
📝 W03 Formative Exercise - Automated Data Collection
2024/25 Autumn Term
🤔 Am I ready to start this exercise?
⚠️ BIG WARNING: If you are NOT caught up or you don’t understand concepts introduced in the activities listed below, revisit them, practice typing the commands on the Python shell (or Jupyter) and post messages with lingering questions to the #help channel on Slack ASAP, or attend a support session next week (check the 📔 Syllabus for times.). Things will start to pile up quickly if you don’t address them early on. If there are no questions, we will assume everyone is ready to proceed to more complex topics.
You will benefit more from this exercise if you are caught up with the tasks below:
-
- You can also revisit the 🧑🏫 W02 Lecture Notes for summaries.
Context
⏳ How long will this take?
| Estimated Time | Explanation | |
|---|---|---|
| Task 1 | 10 min | if you’ve been doing all the exercises and attended the 👨🏻🏫 W02 Lecture in person. (allow +10 min more if you haven’t) |
| Task 2 | 15 min | if you went to the 💻 W02 Lab and sorted all questions there. (\(\pm\) 20 min more if you need to recap) |
| Task 3 | 30 min | if you read and follow instructions very carefully as intended while taking notes of questions to ask. (some 30 minutes more if you need to revisit the 👨🏻🏫 W02 Lecture) |
| Task 4 | 50 min | This is a bit more challenging, but you should be able to do it if you’ve been following the lectures and exercises and you got a good grasp of functions from Task 3. |
| Challenge | \(\infty\) minutes | This is a challenge, after all. We’re not expecting anyone to be able to complete it 😬 |
⏲️ Due Date:
- Wednesday, 16 October 2024, 8.00 PM (the day before the lecture)
📃 Submission
- You should submit your solutions entirely via the Nuvolos Cloud platform. I will look at the solutions you submit there and explore common mistakes in the next lecture.
🎯 Main Objectives:
The goal of this exercise is to help you practice the following skills:
- Data Collection: You will learn how to collect data from the Internet using the
requestslibrary in Python. - Data Storage: You will revisit how to store data in a JSON file using Python.
- Data Inspection: You will learn how to inspect the structure of the data you collect and how to use Jupyter Notebook to interact with the data and confirm that it is correct.
- Functions: You will learn how to write functions in Python to automate repetitive tasks.
📋 NOTE: We will not provide any files directly. You are expected to create your own files and directories as needed through the Nuvolos Cloud terminal.
Task 1: Setting up
🎯 ACTION POINTS:
Open the
W03-Practicefolder on VS Code. You shouldn’t need to create this folder; it should already be there. Open VS Code from the Applications tab. Then, on the menu at the top of the app, click onFile>Open Folder.... Navigate to/files/W03-Practiceand clickOpen.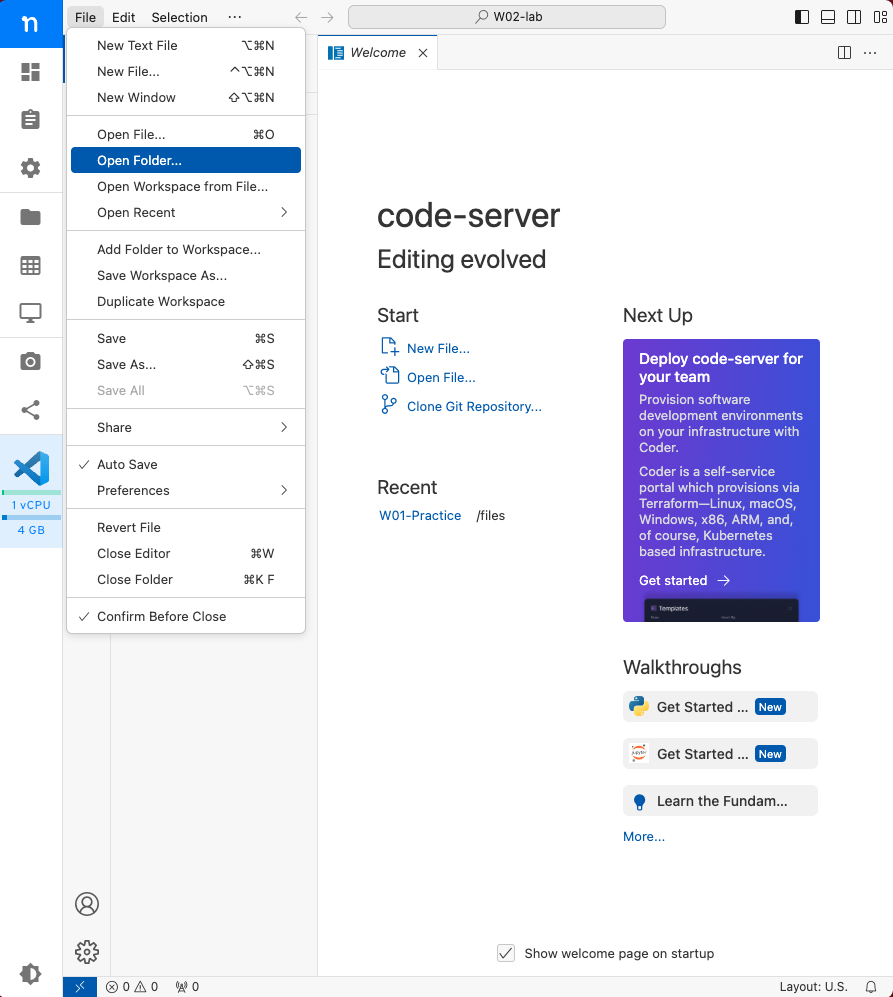
Figure 1. How to open a folder in VS Code. After this, navigate to the location of “W03-Practice” to open it. Start the Terminal from within the Nuvolos VS Code.
On the menu bar at the top of VS Code, click on
Terminal>New Terminal. This will open a new terminal window at the bottom of the VS Code window.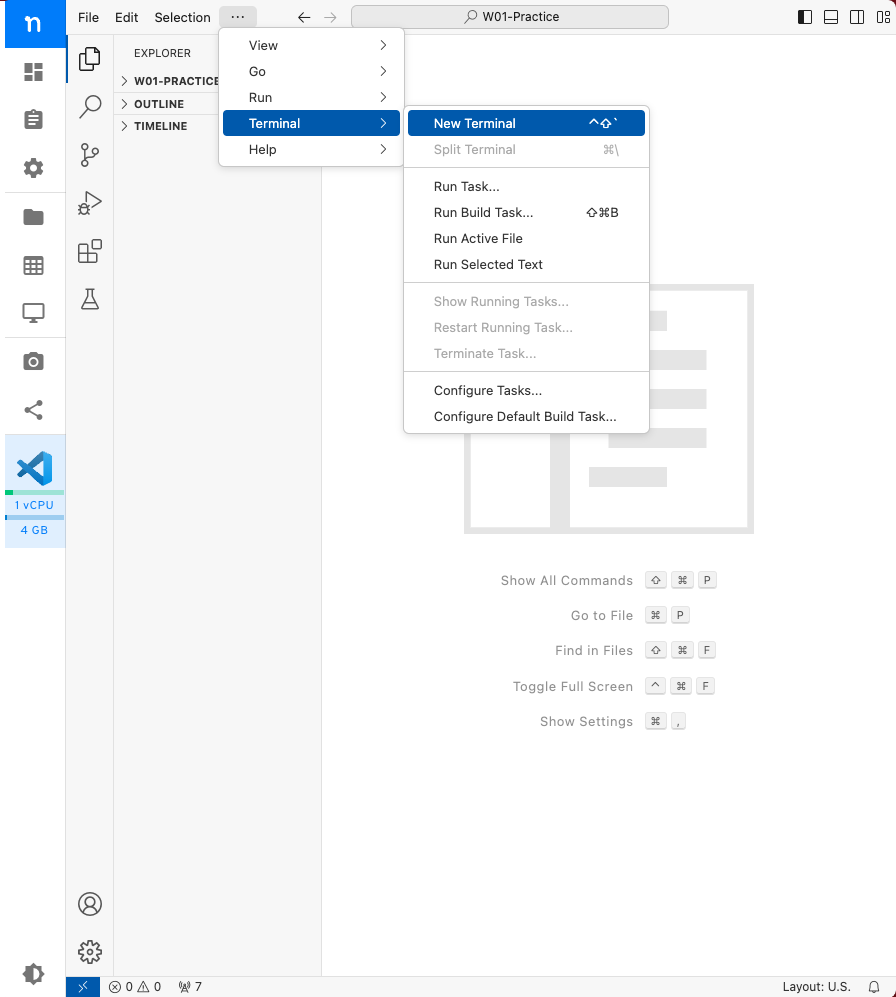
Figure 2. How to open a new Terminal window without leaving VS Code. Ensure you have the following directory structure. Use the terminal to create plain text files or directories as needed.
W03-Practice/
├── README.md
├── data/
└── code/
From within VS Code (not the Terminal), create a Jupyter Notebooks inside the “code” directory. Put your mouse on the “code” folder, right-click and select “New File” then name it “NB01 - Data Collection.ipynb”.
You should have a file structure that looks like this:
W03-Practice/
├── code/
|    └── NB01 - Data Collection.ipynb
├── data/
└── README.md
📋 NOTE: The name and filename extension of the notebook are important details.
Download the
world_cities.csvfile and place it atW03-Practice/data/world_cities.csv.This file is available on the joelacus / world-cities repository on
 GitHub and there are two ways you can download it:
Go to that page then click on the file named
world_cities.csv. Once the file opens, right-click on the “Raw” button and select “Save link as…” to save the file to your computer. Then, on Nuvolos, right-click on thedatafolder and select “Upload…” to upload the file.Go to that page then click on the file named
world_cities.csv. Once the file opens, right-click on the “Raw” button and select “Copy Link”. This will store the URL of the file in your clipboard. If you paste this URL into the terminal, you can use your knowledge ofcurl(from the 💻 W02 Lab) to download the file directly to thedatafolder.
Click here for spoilers
cd W03-Practice/data
curl https://raw.githubusercontent.com/joelacus/world-cities/main/world_cities.csv > world_cities.csv
or
cd W03-Practice/data
curl -O https://raw.githubusercontent.com/joelacus/world-cities/main/world_cities.csv
The -O parameter tells curl to use the filename that comes at the end of the URL. In this case, it will download the file as world_cities.csv.
If you weren’t on Nuvolos and wanted to do the same on a ![]() Windows machine, you could use the
Windows machine, you could use the Invoke-WebRequest command in PowerShell to download the file.
cd W03-Practice/data
Invoke-WebRequest -Uri "https://raw.githubusercontent.com/joelacus/world-cities/main/world_cities.csv" -OutFile "world_cities.csv"- 🔔 Reminder Submit your work before you proceed to the next task!
✅ Click here to check your understanding of Task 1
✅ Check your understanding
If you look on the left-hand side of Nuvolos, on the place where you see the directory structure, you should see exactly this structure:
W03-Practice/
├── code/
|    └── NB01 - Data Collection.ipynb
├── data/
|    └── world_cities.csv
└── README.md
If you do, then you have successfully completed Task 1. Otherwise, you might need to move some files around or create new ones. Remember to ask for help if you get stuck!
Task 2: Collecting data from APIs using Python
You’ve learned how to collect data with curl (in the 💻 W02 Lab). Now, let’s use Python to collect data from the Internet. Here we will use the requests library to connect to the Internet and collect weather data from the OpenMeteo publicly available free API 1. We will then save this data to a JSON file.
🎯 ACTION POINTS:
Add a Markdown cell to the first Jupyter Notebook. Click on the “NB01 - Data Collection.ipynb” file on VS Code, and type the following content:
**OBJECTIVE:** Collect weather data from the OpenMeteo API and save it to a JSON file.

**AUTHOR:** [Your Name or your GitHub username if you already have one account on GitHub]

**LAST EDITED:** [The current date]

---
Replace the content within square brackets with your information. This is a good practice to keep track of who created the notebook and when it was last edited.
Add a Python cell to the notebook below the Markdown cell. We will keep all imports here, at the top of the notebook. At any point, if we feel like we need a new library, we go back to the top of the notebook and add the import statement there.
Add the following import statements to the cell:
import requestsAdd a section to collect weather data from the OpenMeteo API.
Create a new Markdown cell and type:
# 1. Collect Weather DataThe
#symbol is used to create headings (a big title) in Markdown cells. This is a good practice to organise your notebook and make it easier to navigate.Then, add a new Python cell below the Markdown cell and type:
base_forecast_url = "https://api.open-meteo.com/v1/forecast?"

params_lat_long = "latitude=51.5085&longitude=-0.1257"
params_others = "&hourly=temperature_2m"

final_url = base_forecast_url + params_lat_long + params_others

response = requests.get(final_url)

response
Your notebook should look like this:
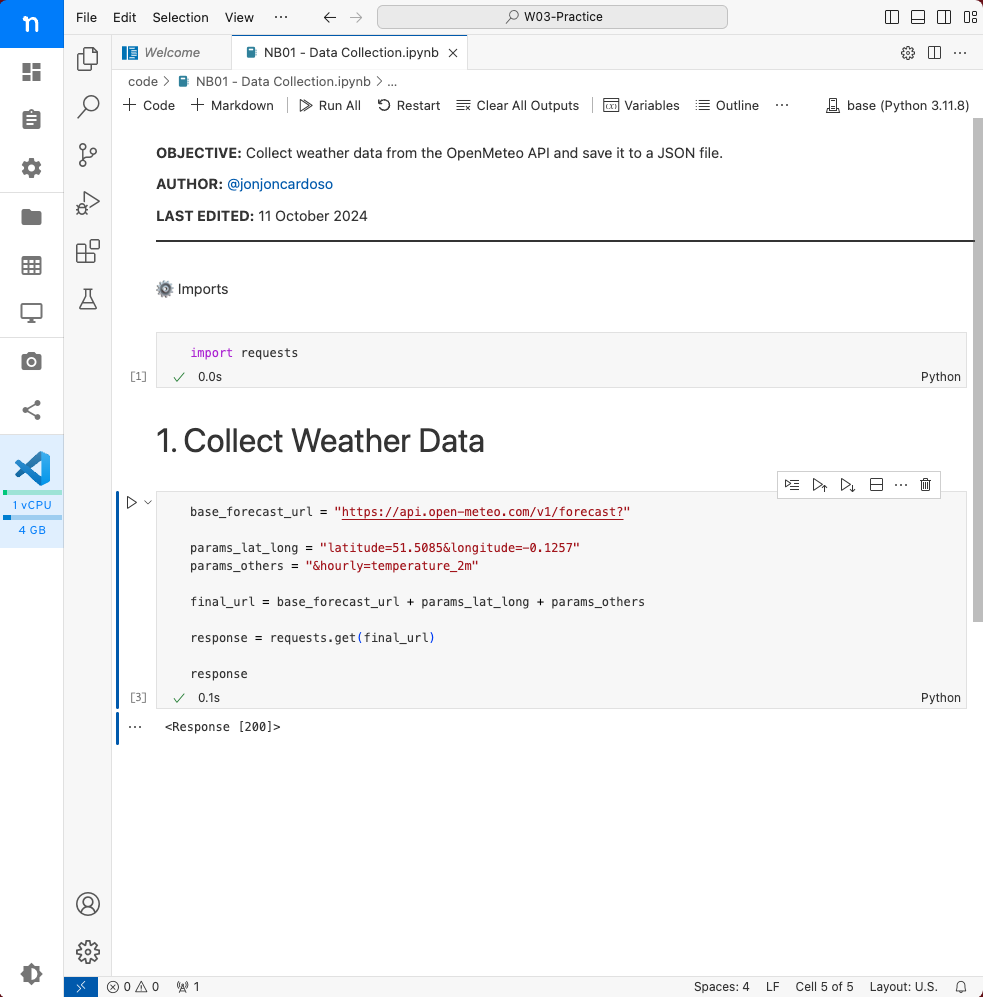
Figure 3. The first part of the notebook should look like this. Inspect the response object.
The
responseobject is not a primitive data type like a string or a number. It is a complex object that contains a lot of information about the response from the server. For example, you can check the status code of the response by typing:response.status_codeIf your request was successful, you should see a status code of
200. If you see a different status code, it means that something went wrong with your request or with your internet connection.Usually, we are interested in the content of the response. You can access the content of the response by typing:
response.contentYou should see a lot of data in the form of a string. This is the raw data that the server sent back to you. Scroll up and down to see the content of the response.
🤔 Think about it. Does the structure of the output resemble anything you’ve seen in this course already?
Collect the response as a JSON object.
The
responseobject has a useful method calledjson(). This method will parse the content of the response and convert it into a Python object. You can use this method by typing:data = response.json()🤔 Think about it. What is the type of the
dataobject? How many elements does it have?Save the data to a JSON file.
We can reuse the code we used last week, in the Task 3 of 📝 W02 Formative Exercise, but first we need to import the
jsonmodule.Go back to the top of the notebook, where you imported the
requestsmodule, and add theimport jsonstatement there. That way, all the imports are at the top of the notebook and easy to find. The imports section should look like this:import json import requestsRun that cell again to make sure the
jsonmodule is imported.Scroll down to the bottom of your notebook, add a new Markdown cell and type:
# 2. Save Data to a JSON FileAdd a new Python cell below the Markdown cell and type:
with open("../data/forecasted_temperatures.json", "w") as file:
    json.dump(data, file)
🤔 Think about it. Why did we use
../when specifying the path to the file in the notebook?
🔔 Reminder Submit your work before you proceed to the next task!
✅ Click here to check your understanding of Task 2
✅ Check your understanding
After completing this task, you should be able to explain the following to a colleague:
💭 Think about it: a good indicator that we have grasped a new concept is when we can clearly explain it to others.
Task 3: Write a function to automate repetitive tasks
We only worked with a single location in the previous task. We were also just interested in the temperature at a specific time.
It would be very tedious to write the same code over and over and over and over again if we wanted to collect weather data from multiple locations or multiple indicators (beyond temperature), or at different times. In Python, we can automate repetitive tasks by writing functions. We will practice with that here.
I will give you a base to start off with (forecast) and at the end, I will ask you to replicate the process for a different endpoint of the OpenMeteo API (historical data).
🎯 ACTION POINTS:
Edit the first heading of the notebook to reflect the new objective.
Notebooks are living documents. They change as you work on them. Go back to the Markdown cell where you have the heading “Collect Weather Data”, double-click on it to make it editable and replace it entirely with this whole new content:
# 1. Data Collection Strategy

In this notebook, I will focus on two endpoints of interest on the [Open-Meteo API](https://open-meteo.com/en/docs):

| Endpoint         | URL starts with                      |
|------------------|--------------------------------------|
| [Weather Forecast](https://open-meteo.com/en/docs)                            | `https://api.open-meteo.com/v1/forecast`          |
| [Historical Weather Data](https://open-meteo.com/en/docs/historical-weather-api) | `https://archive-api.open-meteo.com/v1/archive`   |

We will compare the following locations for now:

- London
- XXXXX

And we will compare the weather forecast in the period of a week (from now) with the historical data from the same period last year.
Replace
XXXXXwith the name of a city of your choice that can be found in theworld_cities.csvfile.Hit Ctrl + Enter to let the changes take effect. You will see that the formatting above produced a magical table made entirely with organic Markdown materials!
This new revision of the notebook is more inline with what we want to do: we will collect data about multiple locations and two different types of data (forecast and historical).
📋 NOTE: We will be doing a lot more of this rewriting of the notebook from now. Are you prepared?!
Check a few things first.
Before we write a function, let’s adapt the code we have so far. The script above already collects data for the next 7 days. Let’s confirm that this is the case.
Go to the cell where you have the
data = response.json()line and rename the variable toforecast_data. This will help us differentiate between the forecast data and the historical data we will collect later.Then, add a new Python cell below the one you just edited and add the following line below it:
forecast_data['hourly']['time']Notice where the date starts and where it ends. This will give you an idea of how many days are being forecasted. To be more precise, you can use the
minandmaxfunctions to get the smallest and largest elements in a list.Replace the line above with the following two lines:
print("The earliest date in the forecast is:", min(forecast_data['hourly']['time']))
print("The latest date in the forecast is:", max(forecast_data['hourly']['time']))
Run it again and see if the difference between the two dates is 7 days. We will eventually learn better ways to work with dates in Python, but for now, this is a good way to manually confirm that.
Save just the temperatures to a list.
We are interested in the temperatures for now. Let’s save just the temperatures to a list. Add a new Python cell below the one you just edited and type:
forecast_temperatures = forecast_data['hourly']['temperature_2m']This will give you a list of hourly temperatures for the 7 days starting midnight today.
You can check the length of the list by typing:
len(forecast_temperatures)You should see that the list has 168 elements. This is correct, after all, 7 days x 24 hours = 168 hours.
Repeat this for a second location to see the output change.
Open the file you downloaded earlier (
data/world_cities.csv) and find the latitude and longitude of a second city of your choice. Adjust theparams_lat_longvariable in the code to reflect the new location and rerun the cells to collect the forecast data for the new location.Build a function to run this same code for any location. This here is the beauty of functions!
If we want to keep re-running this code, every time for a difference location, we would need to always manually alter the
params_lat_longvariable. This is not very efficient.Now, imagine there was a function where I could just pass the latitude and longitude of a location and it would return the forecast data for that location. That would be very useful! The code below reuses the code we have written so far and achieves exactly that.
def get_forecast_data(latitude, longitude):

    base_forecast_url = "https://api.open-meteo.com/v1/forecast?"
    params_lat_long = "latitude=" + str(latitude) + "&longitude="  + str(longitude)
    params_others = "&hourly=temperature_2m"

    final_url = base_forecast_url + params_lat_long + params_others

    response = requests.get(final_url)

    forecast_data = response.json()
    forecast_temperatures = forecast_data['hourly']['temperature_2m']
    return forecast_temperatures
There are two key differences from the code we have written so far:
- We have “enveloped” our code inside a function. Functions are specified using the
defkeyword, followed by the name of the function, and then the parameters the function takes. In the end, you have areturnstatement that specifies what the function should return. In this case, the function takes two parameters:latitudeandlongitude. This means we can reuse this piece of code for any latitude and longitude we want. And it returns a list that we carefully crafted in the previous steps. - Crucially, the
params_lat_longvariable is now constructed dynamically, that is, the latitude and longitude are no longer “fixed” and instead change according to the values of thelatitudeandlongitudeparameters.
Another minor point is that we have added a
str()function around thelatitudeandlongitudevariables. This is required when we want to join strings with numbers together to build a new string.- We have “enveloped” our code inside a function. Functions are specified using the
Run the function for a location of your choice.
When you run the code above, nothing will show up in the output. This is because you have only defined the function. You haven’t actually run it yet. To run the function, you need to call it:
get_forecast_data(latitude=51.5085, longitude=-0.1257)I like to think of functions as if they were a service I can request. I invoke the
get_forecast_data()"service", informing the parameters of the location I want to know the forecast for. The function then `“serves" me the temperatures for that location as a list.To run the function for a different location, you can simply call the function again with different arguments:
# Using Paris here as an example. You should use a different location.
get_forecast_data(latitude=48.8566, longitude=2.3522)
You can also save the output of the function to a variable and then use that variable to do further analysis. For example:
london_temperatures = get_forecast_data(latitude=51.5085, longitude=-0.1257)
paris_temperatures = get_forecast_data(latitude=48.8566, longitude=2.3522)
Store temperatures in a dictionary.
We can store the temperatures for multiple locations in a dictionary. Add a new Python cell below the one you just edited and type:
temperatures = {
    "London": london_temperatures,
    "Paris": paris_temperatures
}
This will create a dictionary where the keys are the names of the locations and the values are the lists of temperatures.
Save the dictionary to a JSON file. Reuse the code from the previous task and save this dictionary to the
./data/forecasted_temperatures.jsonfile.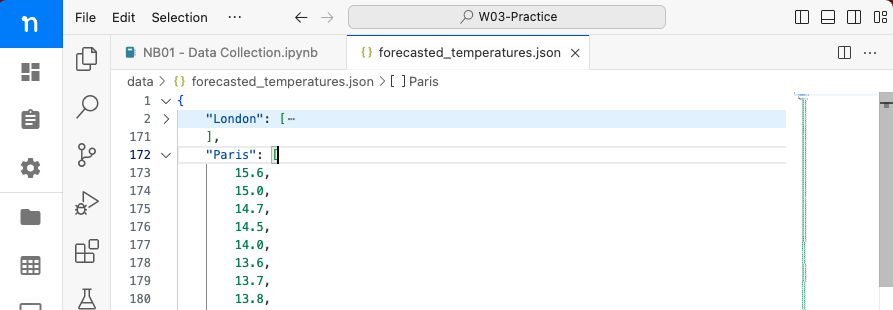
Figure 4. The JSON data will look like this. Here I hid the London data, just to show we have two keys in the JSON file. Tidy up your notebook. Edit the Markdown and Python cells to make sure the notebook is well-organised and easy to read.
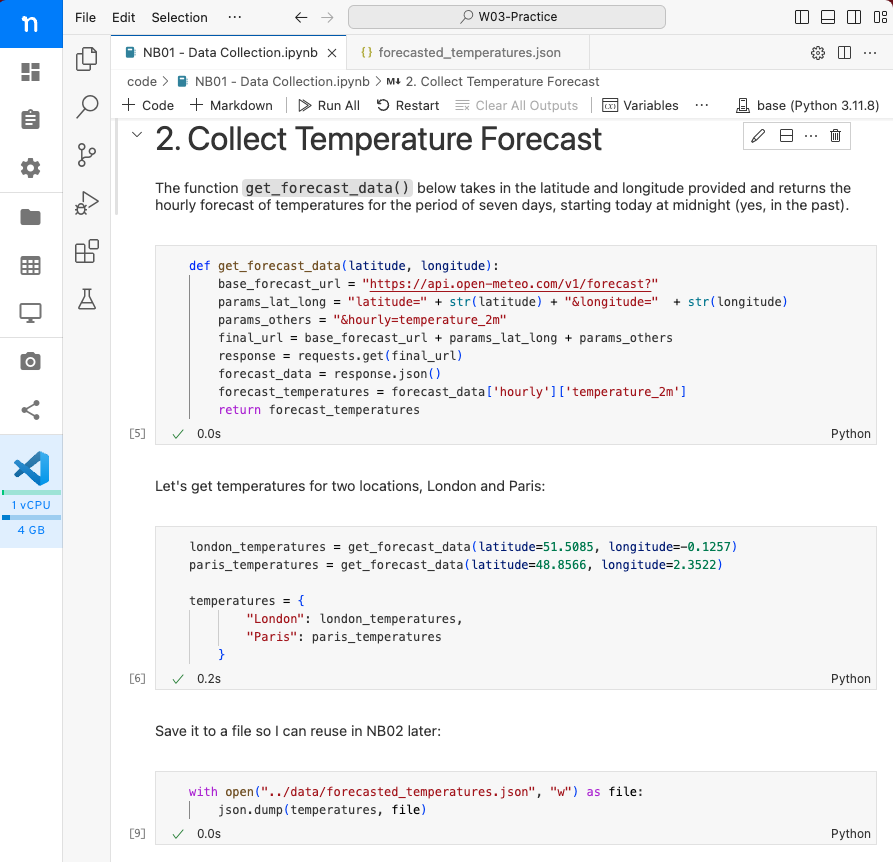
Figure 5. The second section of your notebook should look like this. 🔔 Reminder Submit your work before you proceed to the next task!
✅ Click here to check your understanding of Task 3
✅ Check your understanding
After completing this task, you should be able to explain the following to a colleague:
Task 4: Collecting historical data
You won’t have any guidance on this one. Your goal is to replicate the process we did above, but now for the historical data.
At the end of this task, your notebook should have the following structure:
- A third section called “3. Collect Historical Data” with a Markdown cell explaining what you are doing.
- A function called
get_historical_datathat has four parameters:latitude,longitude,start_date, andend_date. This function should return the historical data for the specified location and time period. - Code to write the historical data to a JSON file at
/files/W03-Practice/data/historical_temperatures.json.
🔔 Reminder Keep submitting your work every time you feel like you made good progress – even if your notebook isn’t tidy yet.
🤨 How would you know if it worked?
If you have successfully completed this task, you should be able to:
You should be able to check the above points by running the code in the notebook and inspecting the output. You could even make creative use of the building blocks we have learned so far and write code that checks these points above for you.
🏆 Challenge
If you already had the time to practice some Python, you can try to solve the following challenge.
Gather and store data about 10 different locations. Edit the NB01 notebook to collect data from 10 different locations and store the data in a dictionary. Re-run the entire notebook to collect the data for all locations and update the JSON files.
Create a second notebook in the
codedirectory calledNB02 - Simple Data Analysis.ipynb.Read the two JSON files. In NB02, read the two JSON files you created in the first notebook and save them to two different variables.
Create a new dictionary called
temp_comparisonto store a comparison of the temperatures.The new dictionary should have the following structure, two keys (forecast and historical), each with another dictionary as a value. This dictionary should have the names of the locations as keys and the list of temperatures as values.
For example:
{
    "forecast": {
        "London": [list of temperatures],
        "Paris": [list of temperatures]
    },
    "historical": {
        "London": [list of temperatures],
        "Paris": [list of temperatures]
    }
}
Check that your transformation is correct. If your produced the expected dictionary, then the complicated code below should run without errors and produce a comparison of the temperatures for the two locations.
# Ideally you should move the imports to the top of the notebook
import numpy as np
import pandas as pd

df_comparison = (
    pd.DataFrame(temp_comparison)
    .explode('forecast')
    .explode('historical')
    .reset_index(names='city')
    .groupby(['city'])
    .apply(lambda x: pd.Series({'avg_temp_diff': np.mean(x['forecast'] - x['historical'])}), include_groups=False)
)

print("Average difference in temperature from this year's forecast and last year's records:")
print(" (per location)")
df_comparison
You should get something like this:
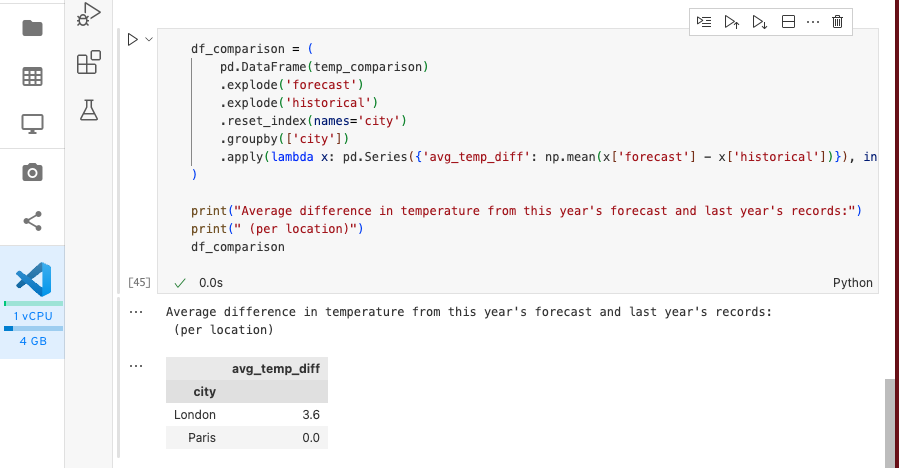
Figure 6. The output of the code above should look like this.
Footnotes
OpenMeteo is free to use provided you don’t use it for commercial reasons, in which case there is a fee associated with each API request.↩︎