
💻 Week 03 Lab
Turning lists and dictionaries into dataframes
📍Location: Friday, 18 October 2024. Check your timetable for the precise time of your lab.
🥅 Learning Objectives
We want you to learn/practice the following goals in this lab:
📋 Preparation
The real preparation required for this lab is to come willing to make mistakes in front of others (it can be a bit comfortable) and to help others when they make mistakes (even if the answers are super obvious to you).
📣 We will experiment with something called pair programming today.
One of you will be the 🧑✈️ Pilot, the person typing the code on the Jupyter Notebook. The other(s) will act as 🙋 Copilot (s) and will NOT write code. Instead, they will help guide the Pilot in what they should do next.
💡 TIP 1: Paradoxically, this might work best if the 🧑✈️ Pilot is the person with less programming experience. But you can swap roles at any time if you want.
💡 TIP 2: If you are playing the role of 🙋 Copilot and you want to share a piece of code, send a Direct Message (DM) to the other(s) on Slack.
Although this is called pair programming, it is OK to do it in groups. Ask your class teacher for help if you need clarification.
Here are the course materials that are most closely related to this lab:
- 💻 W02 Lab,
- 📝 W03 Formative Exercise
- 👨🏻🏫 W03 Lecture
🛣️ Roadmap
Here is how we will achieve the goal for this lab:
Part I: ⚙️ Set Up (10 min)
Everyone should set up their environment for this lab, regardless of the role they will play.
🎯 INDIVIDUAL ACTION POINTS
Let’s assemble all the files we need for this lab.
- Create a folder
W03-Labfor this lab and open it in VS Code. Add acodeand adatafolder inside it.
You can either use Nuvolos or VS Code on your own machine.
- Download the
world_cities.csvfile and place it in thedatafolder.
You already download this file for the 📝 W03 Formative Exercise. You can copy it from there.
Remember how we downloaded the world_cities.csv file
This file is available on the joelacus / world-cities repository on  GitHub and there are two ways you can download it:
Go to that page, then click on the file named
world_cities.csv. Once the file opens, right-click the “Raw” button and select “Save link as…” to save the file to your computer. If you are on Nuvolos, right-click on thedatafolder and select “Upload…” to upload the file.Go to that page, then click on the file named
world_cities.csv. Once the file opens, right-click on the “Raw” button and select “Copy Link”. This will store the URL of the file in your clipboard. If you paste this URL into the terminal, you can use your knowledge ofcurl(from the 💻 W02 Lab) to download the file directly to thedatafolder.
Part II: Coding in pairs (40 min)
Your goal here is to write Python code using the requests library and collect the specified data from the OpenMeteo’s Historical Weather API, the same we’ve been using in the course since last week.
💽 DATA SPECIFICATION CARD:
- City: A selected city from the
world_cities.csvfile. - Date Period: Every single day of the year 2023.
- Variables: Daily minimum and maximum temperatures.
🦸 Your class teacher is equipped with the superpower of conflict mediation. Ask them for help if you are struggling to collaborate or if you feel stuck as a team.
🎯 ACTION POINTS:
👥 Together Negotiate the roles:
Ideally, the person less experienced or less confident with their programming skills should take the role of 🧑✈️ Pilot.
🙋 Copilot(s) should not take over if the Pilot is struggling to understand or follow a suggestion. The whole point of this activity is to figure out how to best express what you know and don’t know to others.
You can decide if and when you want to swap roles for the rest of the lab.
👥 Together Choose a city from the
world_cities.csvfile.🧑✈️ Pilot Open the first notebook on VS Code.
Then, edit section 1.2 to specify the city you chose.
🧑✈️ Pilot Gather the latitude and longitude.
Read and run the Python code contained inside section 1.3 of the notebook, then add the necessary code inside section 1.4.
🧑✈️ Pilot: before you write any code/markdown, you should communicate what you want to do first and why.
🙋 Copilot(s): help the Pilot understand how to use the pre-defined
get_lat_lon()function and how to check if it all worked fine.
🧑✈️ Pilot Build the URL.
Add whatever code is necessary under section ‘2. Collecting Data’ such that you end up with a variable
urlthat contains the correct URL to the API that meets the requirements of the data specification card.👥 Together: Feel free to consult and reuse code we’ve written in the past.
🧑✈️ Pilot: before you write any code/markdown, you should communicate what you want to do first and why.
🙋 Copilot(s): You can help by consulting the API documentation or sharing pieces of code with the Pilot via Slack DMs. If you share pieces of code with the Pilot, explain why they are relevant.
How to find out the URL
It might take some investigative work to determine the URL you need to use to download the data.
When you go to the official page of the API, you will find a lot of parameters you can tweak to get the data you want.
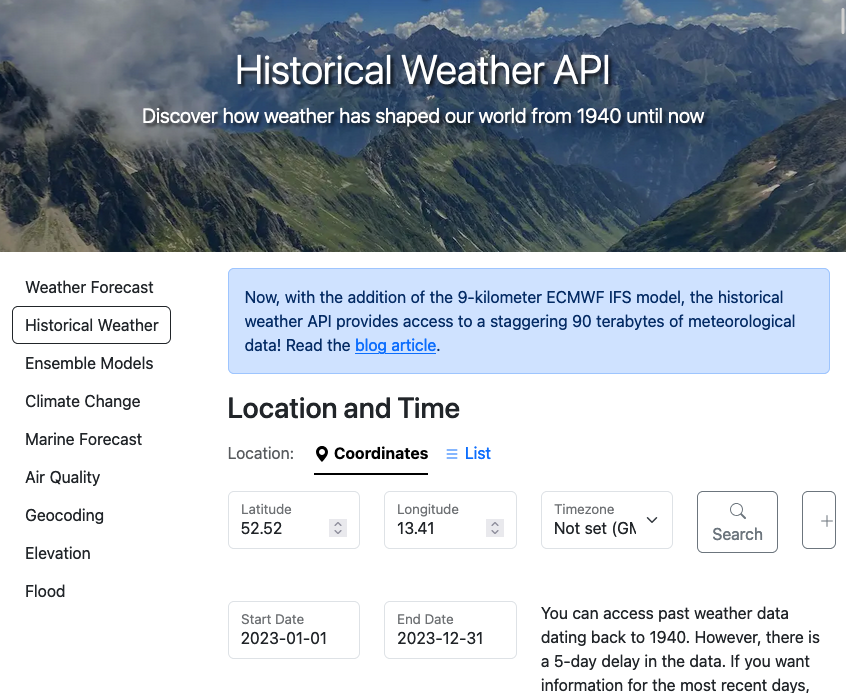
👉 Tweak the parameters to the latitude and longitude of a city of your choice (you can browse the world_cities.csv file) and set the start and end date to the first and last day of 2023.
After changing the parameters, scroll down to the API Response section. You will find the full address (the URL) you need there:
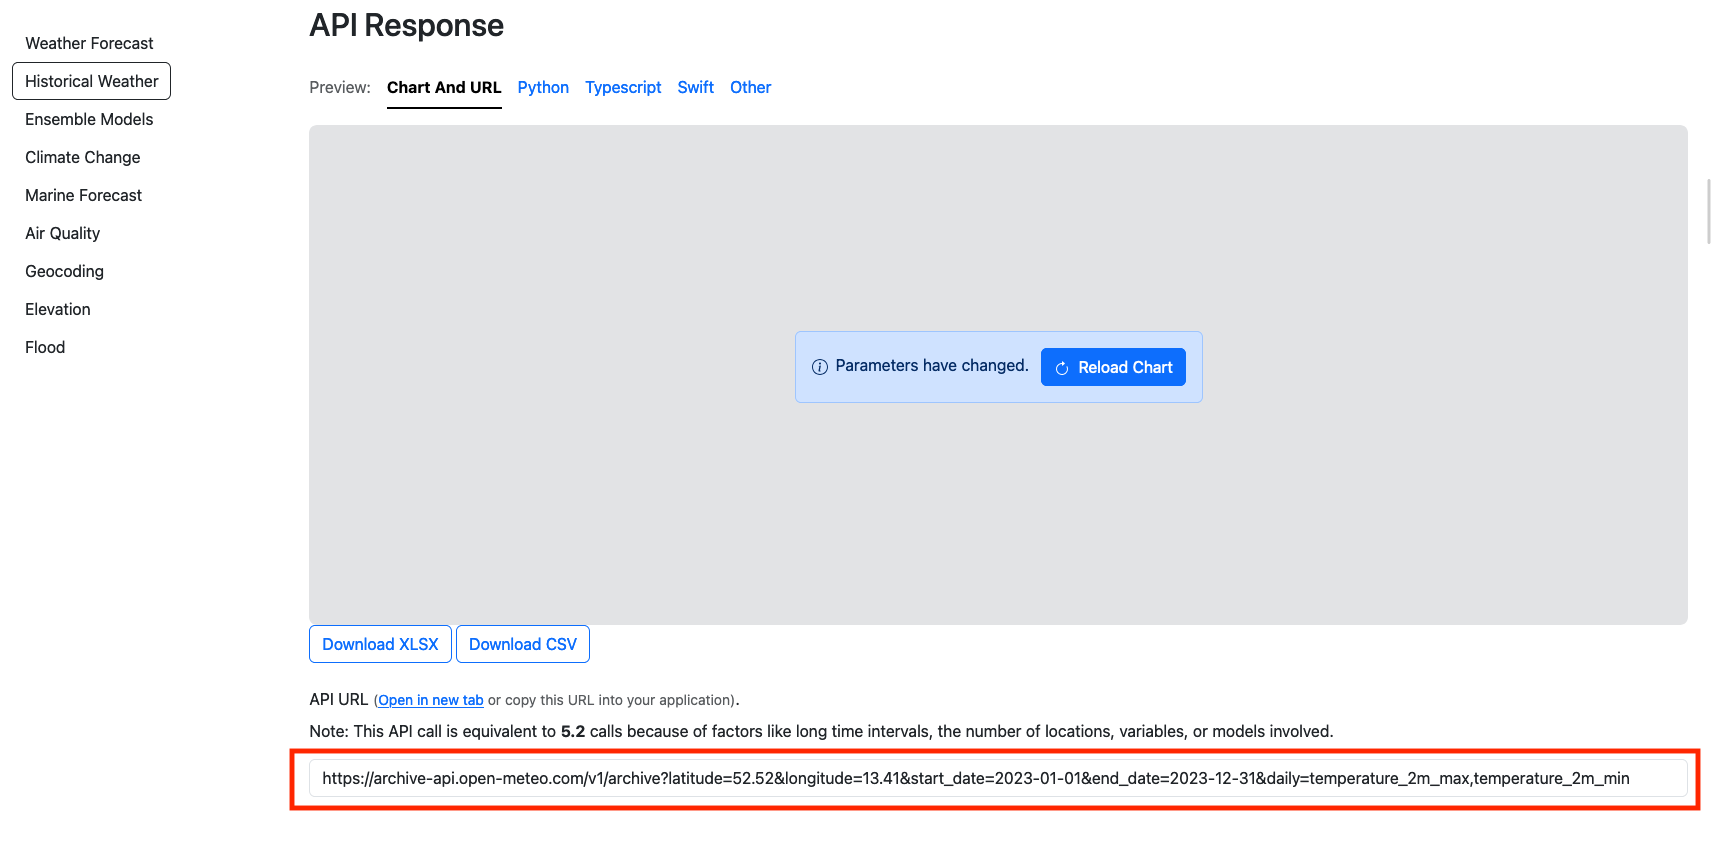
👉 This URL is unique to the specific parameters you chose.
🧑✈️ Pilot Send a request to the URL and convert the response to a Python dictionary.
- 🙋 Copilot(s): Again, if you end up sharing pieces of code, explain why it is relevant and how to adapt it to the current task.
🏆 Reshape the data.
Your goal now is to manipulate the JSON response such that you end up with the Python dictionary like this:
{
"country": "Country Code",
"city": "City Name",
"date": ["2023-01-01", "2023-01-02", ..., "2023-12-31"],
"min_temp": [float, float, ..., float],
"max_temp": [float, float, ..., float]
}
In other words, you need to extract a list of all the dates, a list of all the minimum temperatures, and a list of all the maximum temperatures from the JSON response and then place them in a dictionary with the keys
country,city,date,min_temp, andmax_temp.🧑✈️ Pilot: before you write anything, explain what you would do first.
🙋 Copilot(s): Resist the urge to take over if the Pilot does not understand your suggestion. Explain (or demonstrate) your thinking differently until you both understand what to do.
Save the data to
data/daily_temp.json. Open the file on VS Code to confirm that it has the correct structure.
Part III: 📊 Data Analysis (30-40 min)
We saved the data to a file so that we don’t have to collect the same data over and over again every time we want to continue our analysis.
🎯 ACTION POINTS:
Keep playing the roles of Pilot and Copilot. We just won’t specify in detail how you should work together.
Create a
NB02 - Simple Data Analysis.ipynbnotebook.Add minimal documentation to the notebook: who wrote it, when, and what it is about.
Load the data from
data/daily_temp.jsoninto a Python dictionary.Convert the dictionary into a pandas DataFrame.
Use the code below to create a DataFrame from the dictionary:
df = pd.DataFrame(data)where
datais the dictionary you loaded from the JSON file. Addimport pandas as pdto the top of the notebook if you haven’t done so already.Take a look at the data. Life is easier when we work with tables.
Use
df.head()to see the first few rows of the DataFrame. Usedf.tail()to see the last few rows.Plot the temperatures. Pandas come with the helpful
.plot()function that helps us to get quick insights from a table.Use the code below to plot the minimum and maximum temperatures:
df.plot(x='date', y=['min_temp', 'max_temp'], figsize=(12, 6))Change the dimensions of the plot if you feel the plot is too small or too big.
Check min and maximum temperatures for the whole year.
Once you select a column on Pandas, you can use the
.min()and.max()functions to get the minimum and maximum values, respectively.What is the minimum temperature of all?
df['min_temp'].min()What is the maximum temperature of all?
df['max_temp'].max()🏆 When was the minimal/maximum temperature?
We haven’t taught you how to do this yet. This task will require some online research and investigative work. (Remember to keep playing the role of Pilot and Copilot.)
Here are a few tips:
The columns of a Pandas DataFrame can be converted to simple Python lists using the
.tolist()method. For example,df['min_temp'].tolist()will give you a list of all the minimum temperatures.You can always work with pure Python
listsand then use your knowledge offorloops andlen()to find the minimum value of a list and its index (position in the list).Alternatively, check out the official pandas documentation. Can you find a guide that explains how to filter data based on a condition?
⭐ Bonus Task
Are you a high-performing team? Here is a bonus task to challenge you further.
💽 DATA SPECIFICATION CARD:
- City: A selected city from the
world_cities.csvfile. - Date Period: Every single day from 1st January 2004 to 31st December 2023.
- Variables: Daily minimum and maximum temperatures and precipitation sum.
Edit
NB01 - Data Collection.ipynbto adapt to the new data specification card.Collect the data for the new data specification card and overwrite the
data/daily_temp.jsonfile.
Change the structure of the keys in the dictionary to include the new variables.
On
NB02 - Simple Data Analysis.ipynb, figure out how to plot the precipitation over the years.🏆 Try to write code that answers the following questions:
What was the day with the highest precipitation in the last 20 years?
What was the month with the highest precipitation in the past 20 years? E.g.: was it January 2004? March 2023? Etc.
Is there a month that is consistently the wettest across the years?
Need more challenge? Here’s a super bonus task for you and your team:
🚀 Challenge Task
Collect data for London and five other Western European capitals for the past twenty years. Then, answer: Has it rained more in London than in these other capitals over the past twenty years?