

💻 Week 04 Lab
Cleaning and transforming data with pandas
You might feel very lost if you didn’t attend the lecture. This lab is a direct continuation of the lecture, and we will be using the same files and concepts we introduced there.
📍Location: Friday, 25 October 2024. Time varies.
🥅 Learning Objectives
We want you to learn/practice the following goals in this lab:
- Data Cleaning: Assess what needs to be cleaned in a dataset and implement the necessary transformations.
- Function Writing: Write functions to clean up strings in a pandas DataFrame.
- Iterative Problem Solving: Break down a complex data cleaning problem into smaller, more manageable parts.
📋 Preparation
- Complete at least Task 1 of the 📝 W04 Formative Exercise.
- Attend the 👨🏻🏫 W04 Lecture
- Be ready to play the roles of 🧑✈️ Pilot and 🙋 Copilot(s) in this lab again!
NOTE: The skills you are practising today will be essential for the ✍️ W06 Summative.
🛣️ Roadmap
Here is how we will achieve the goal for this lab:
Part I: ⚙️ Set Up (20 min)
Everyone should set up their environment for this lab, regardless of the role they will play.
🎯 INDIVIDUAL ACTION POINTS
Ensure you have a copy of the files from the lecture.
Let’s assemble all the files we need for this lab. Choose the option that best fits your situation:
Option 1: I cloned the GitHub repository yesterday in the lecture
You’ve been paying attention. You’re a star! 🌟 Try the instructions below for the ultimate experience.
If you are getting stuck or running out of time, ignore this approach for now and try the second option.
Go to the GitHub repository we created yesterday.
Create a fork of it!
Click on the
Forkbutton in the top right corner of the page. This will create a copy of the repository but under your account (so you can make mistakes as you learn without breaking the original).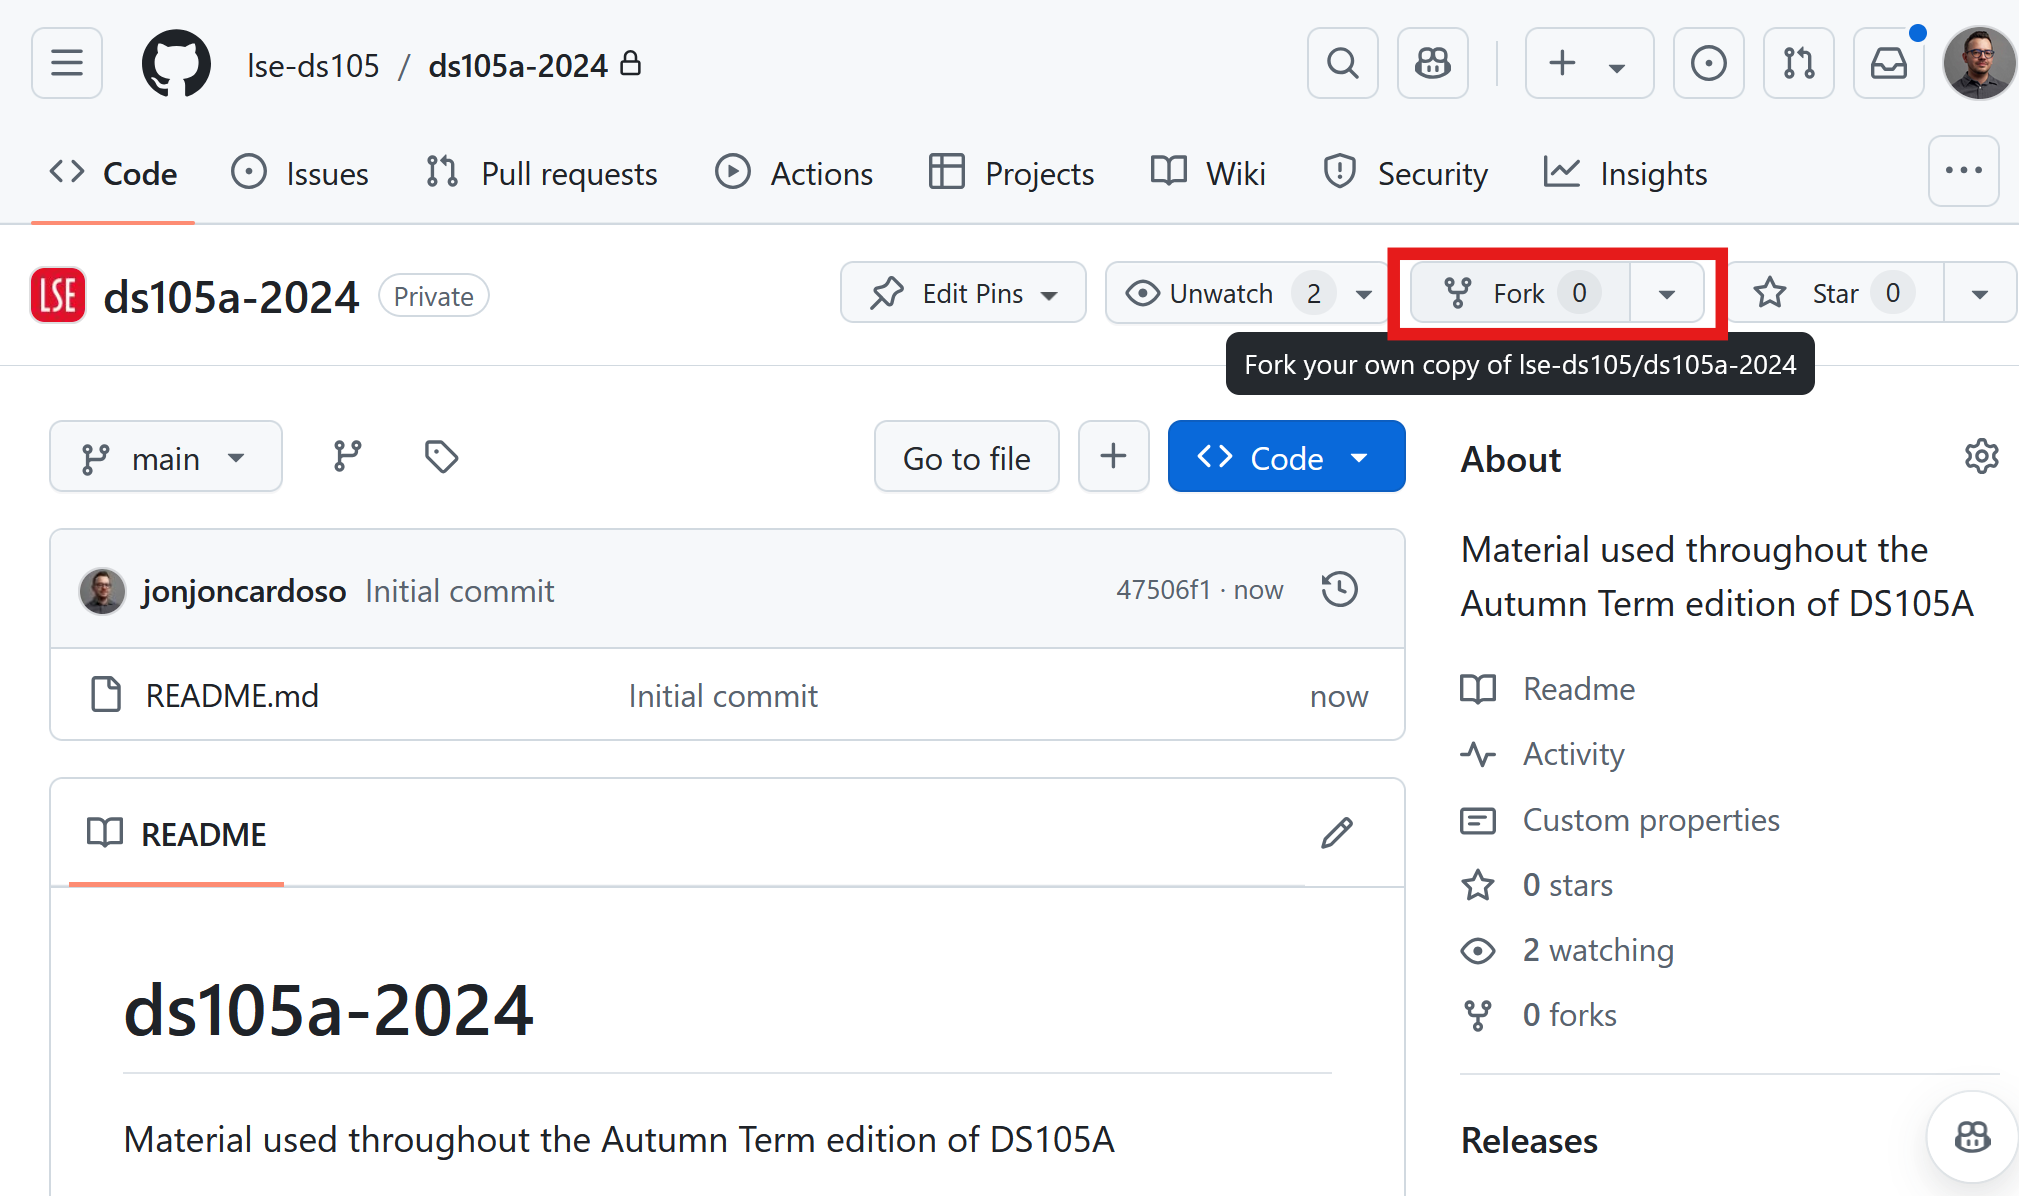
Figure 1. Forking the repository. 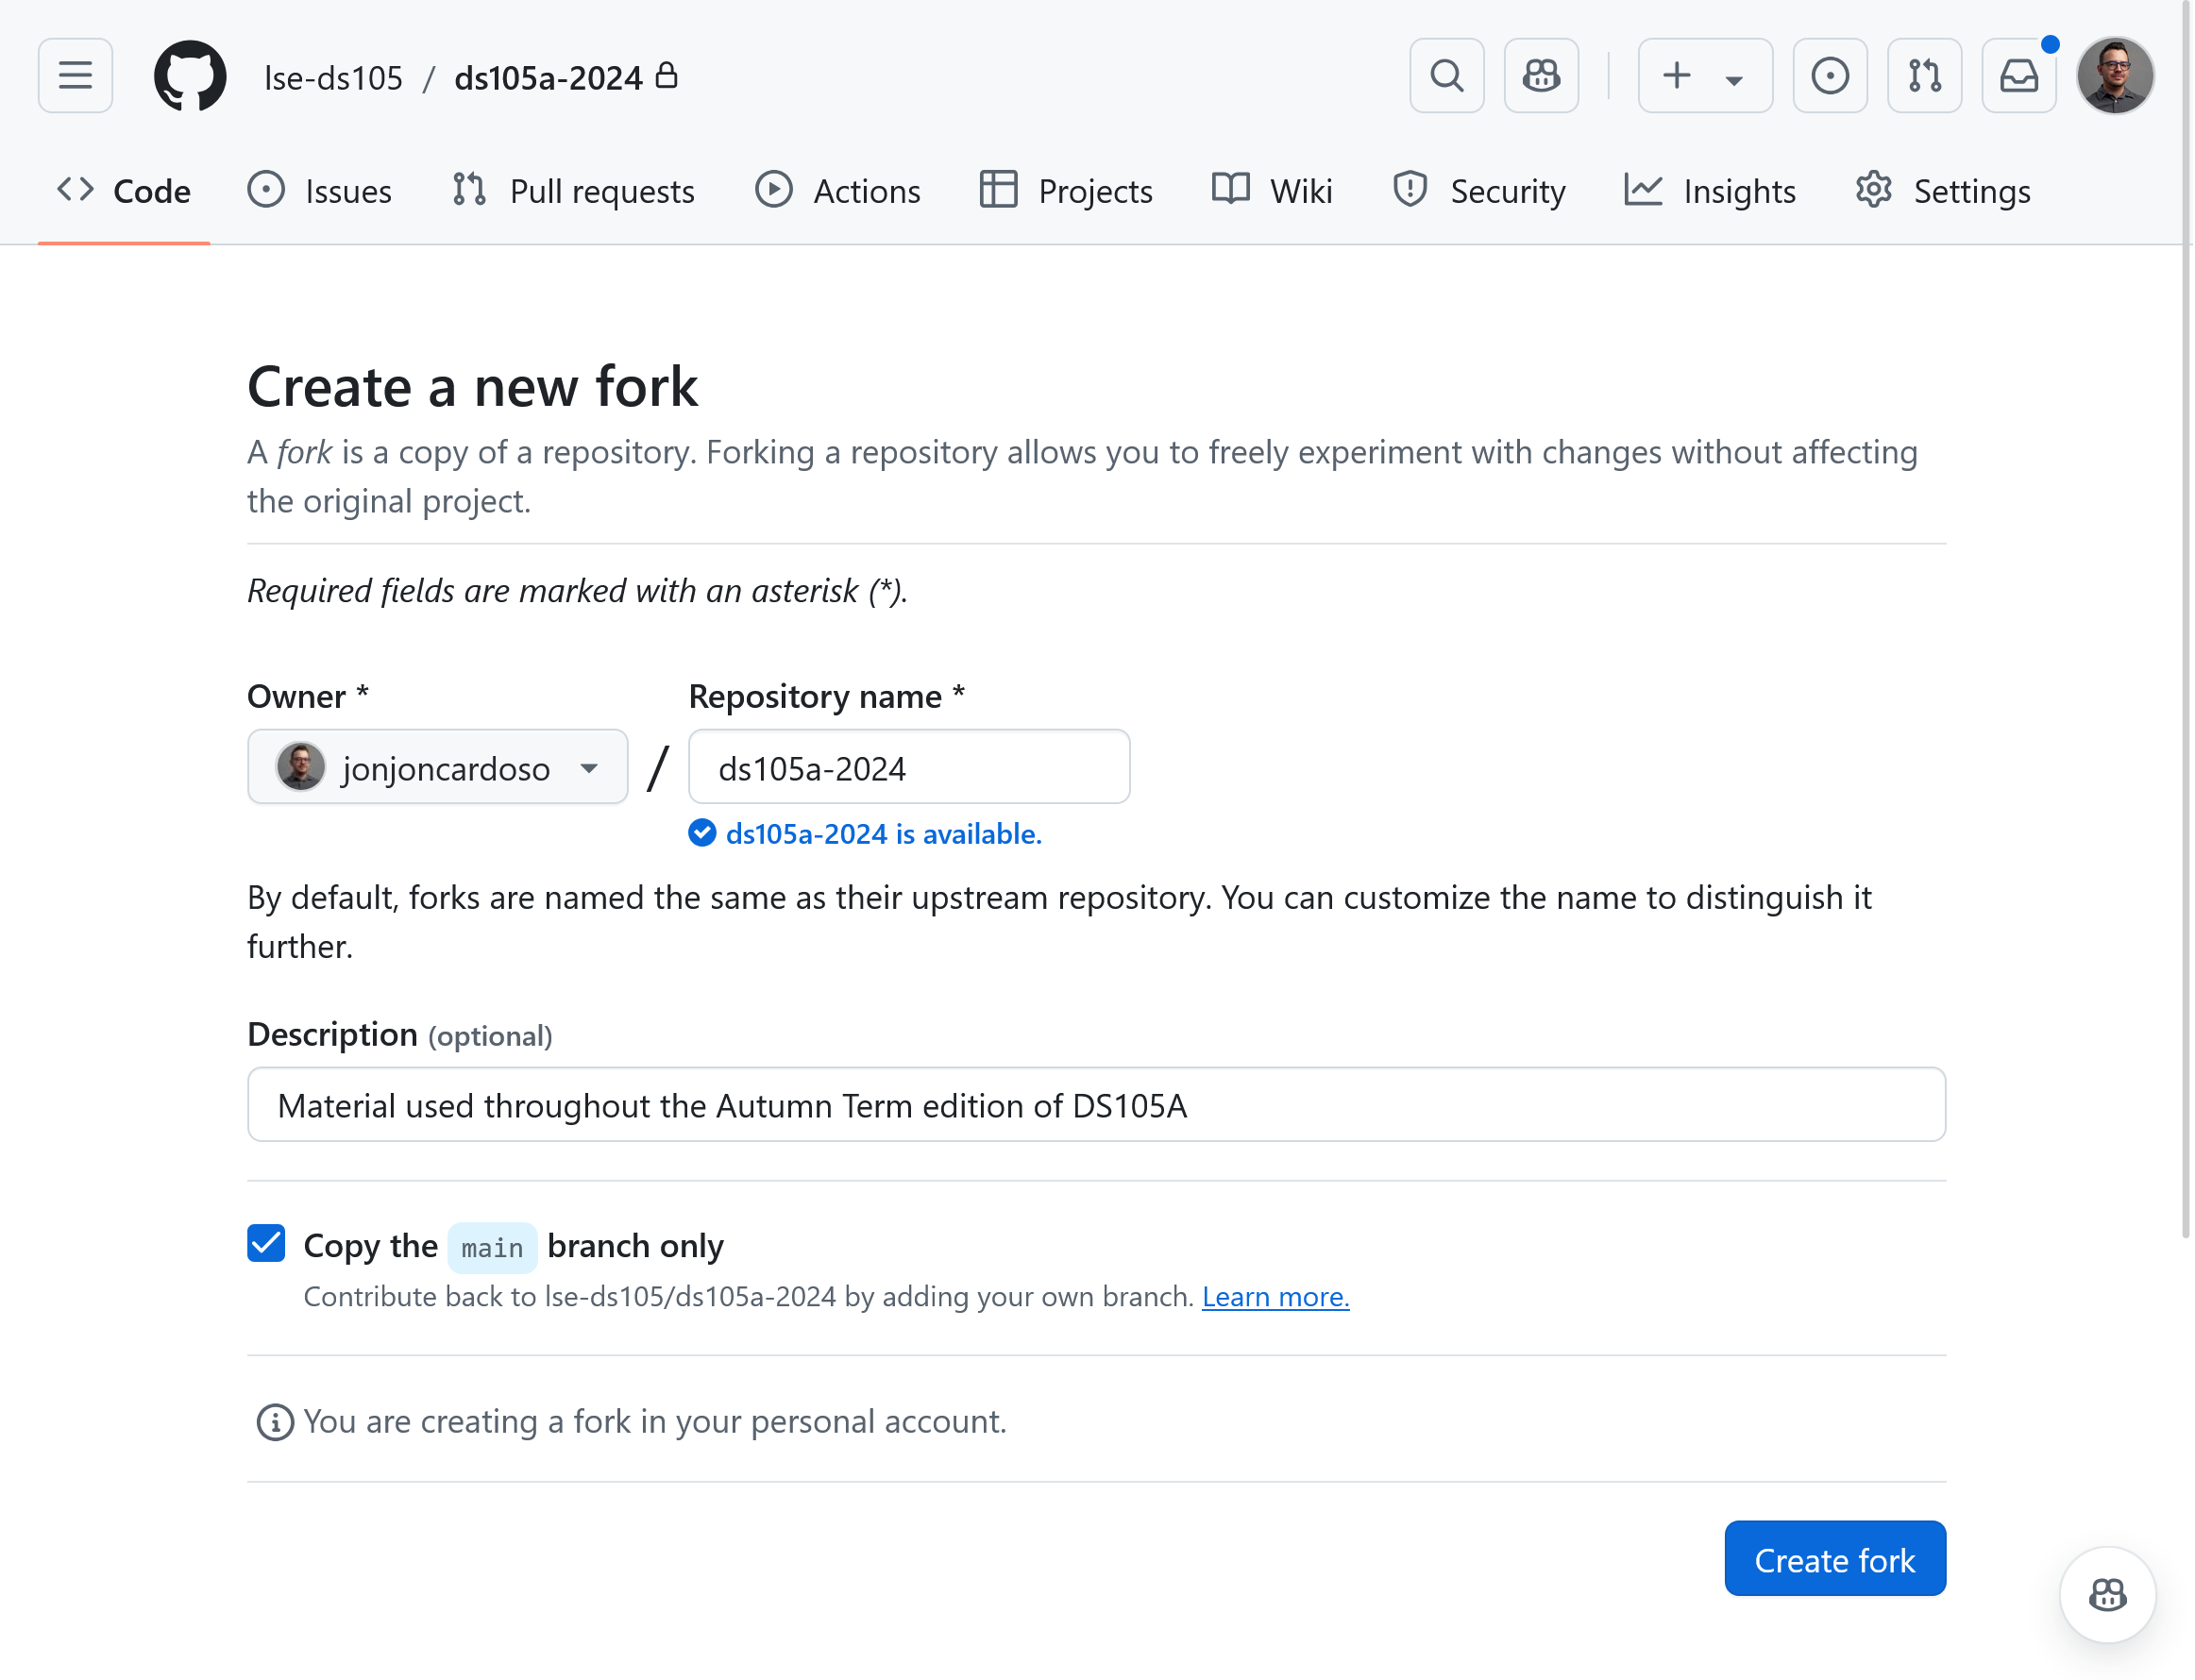
Figure 2. Leave everything as is. 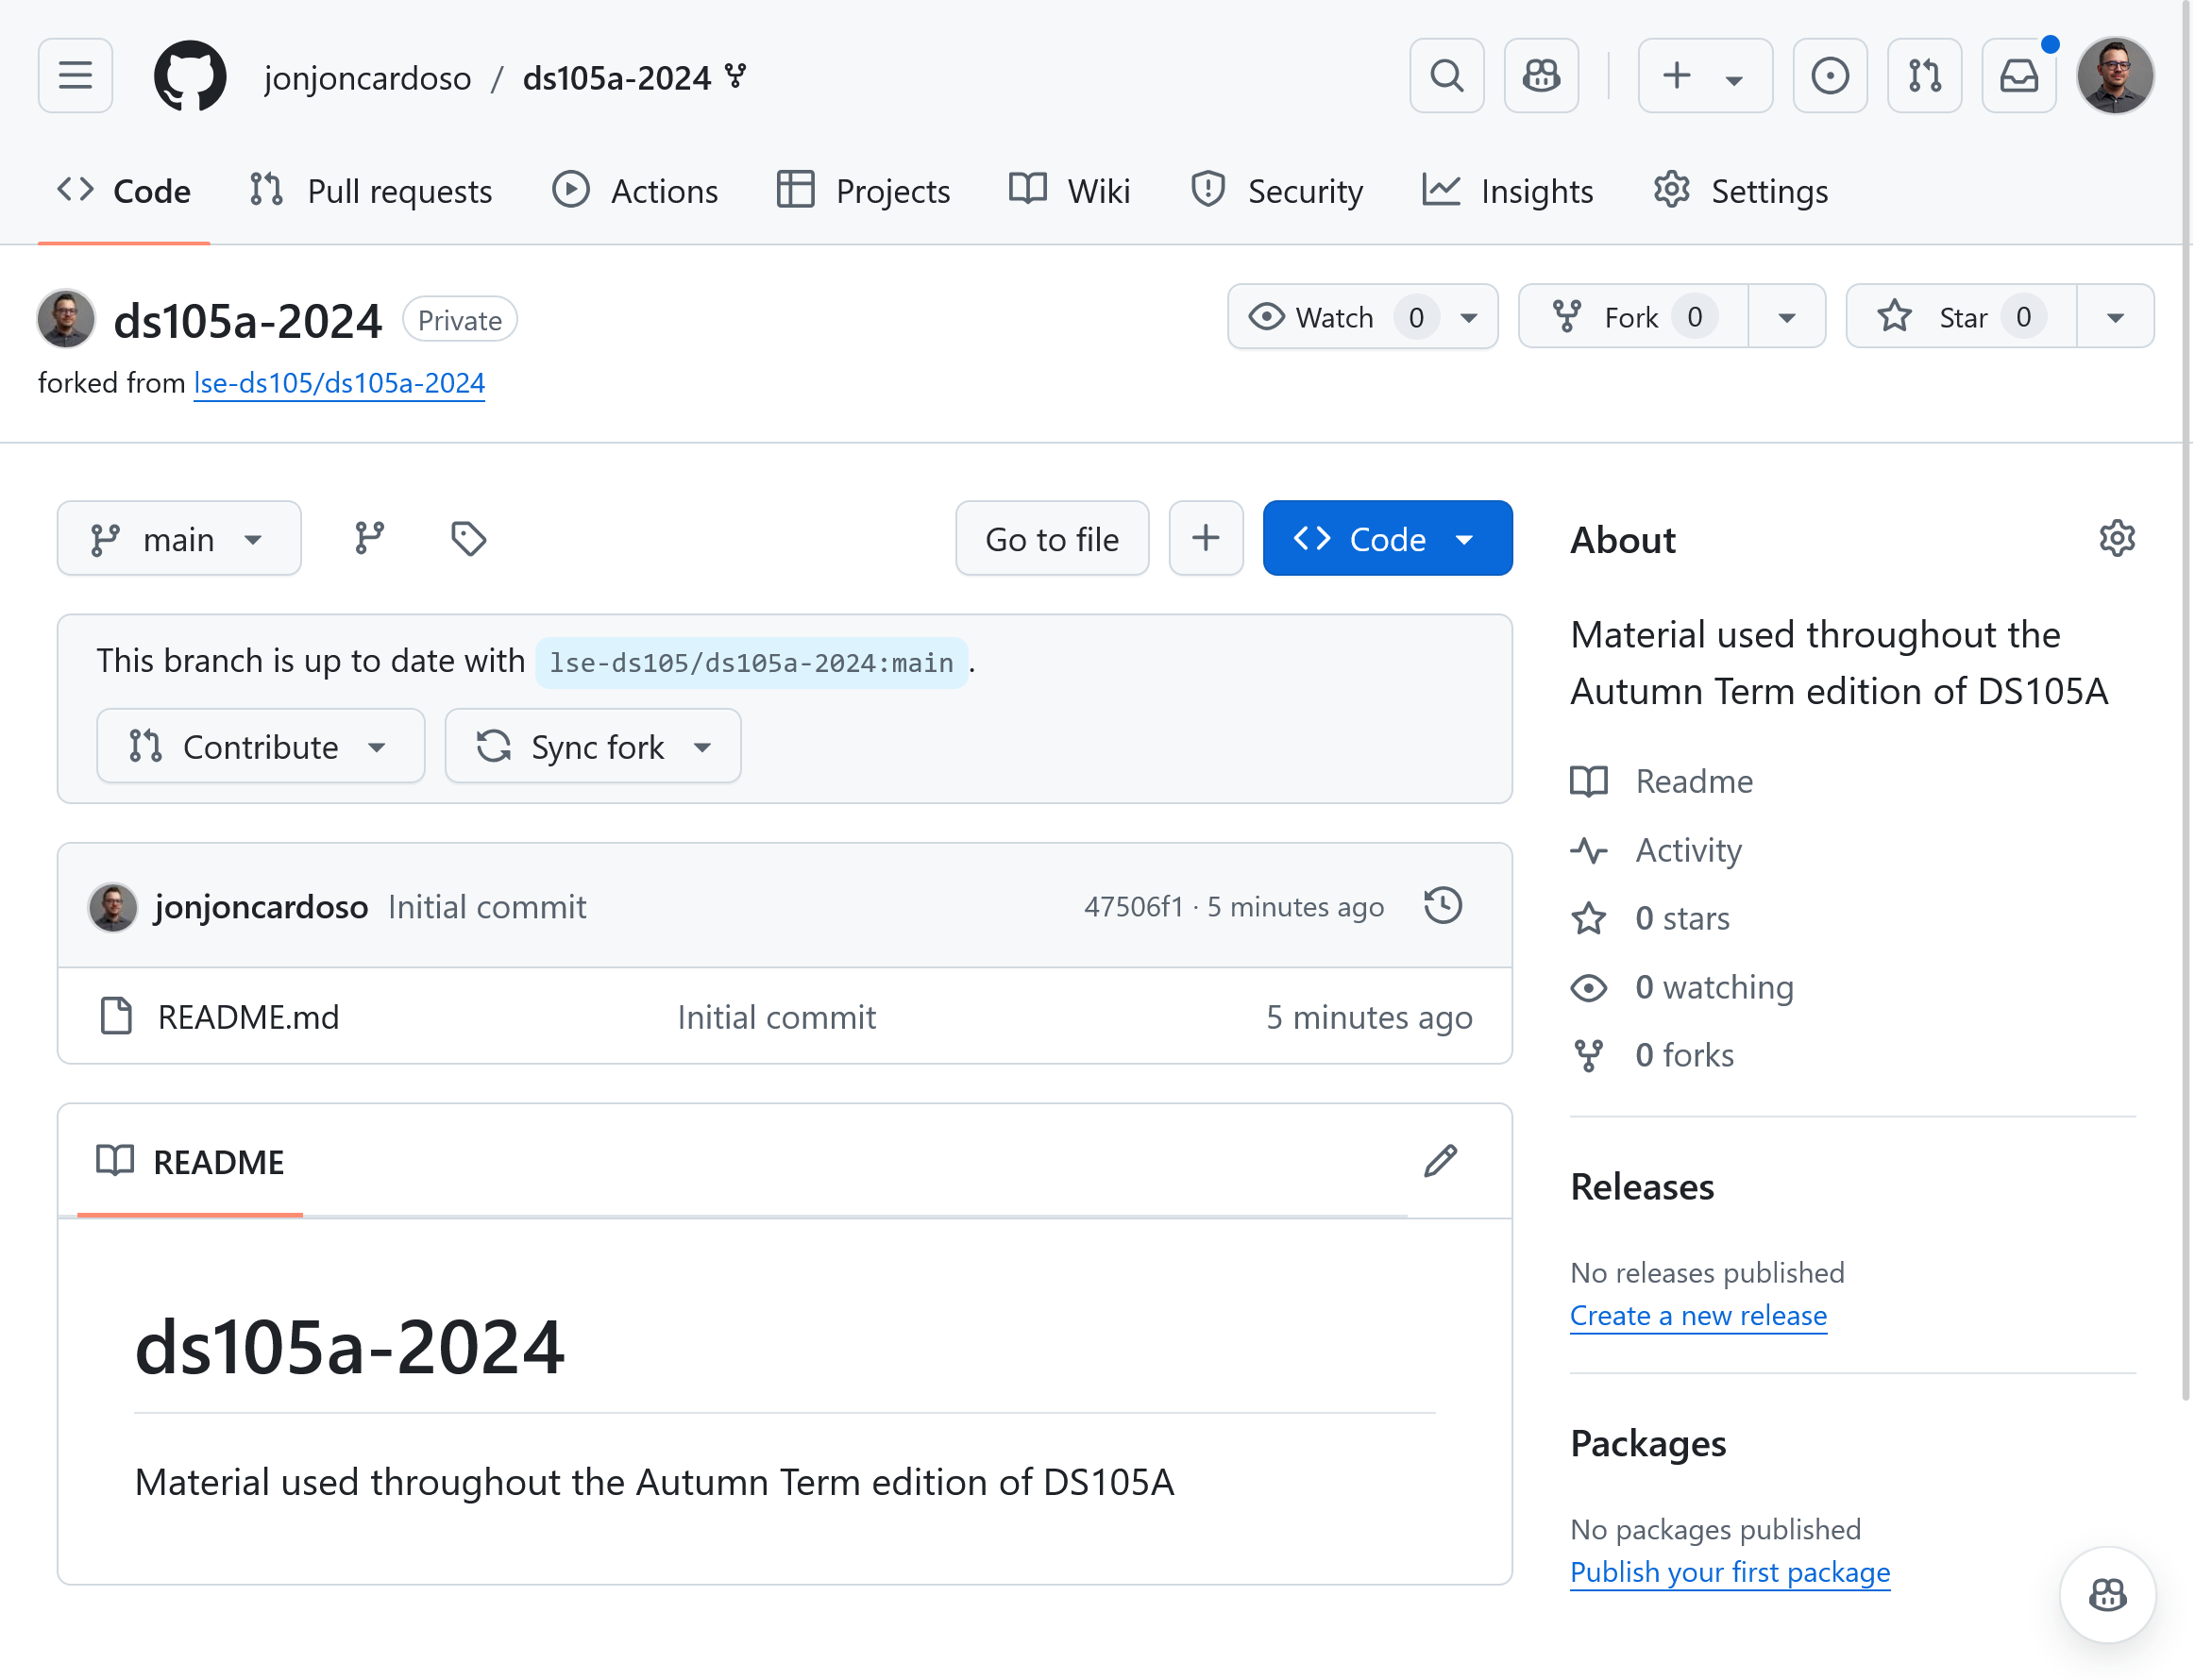
Figure 3. You should see the repository under your account. Rename or delete the old repository
We will clone this new version of the repository to your computer/Nuvolos, but the folder name will be the same as the old one. We need to delete or rename the old one to avoid conflicts.
Whether you are on Nuvolos or your own computer:
- If you took notes on the repository yesterday that you want to keep, rename the folder from
ds105a-2024to something likeds105a-2024-old. If you want to do this via the Terminal, run the commandmv ds105a-2024 ds105a-2024-oldon bash, zsh or the Powershell - Otherwise, it’s safe to delete the folder. If you want to do this via the Terminal, run the command
rm -rf ds105a-2024on bash or zsh. If you are on Powershell, runrmdir ds105a-2024(Press ‘A’ when asked)
- If you took notes on the repository yesterday that you want to keep, rename the folder from
Option 2: I didn’t clone the GitHub repository yesterday or I found the thing above too complicated
Download the W04-Lecture starting files:
Unzip the file.
Use your computer’s file explorer to extract all files and folders from the zip file. Move the extracted folder to an appropriate location on your computer.
If you are on Nuvolos, upload the zip file to Nuvolos to
/filesand unzip it there. See the instructions below:
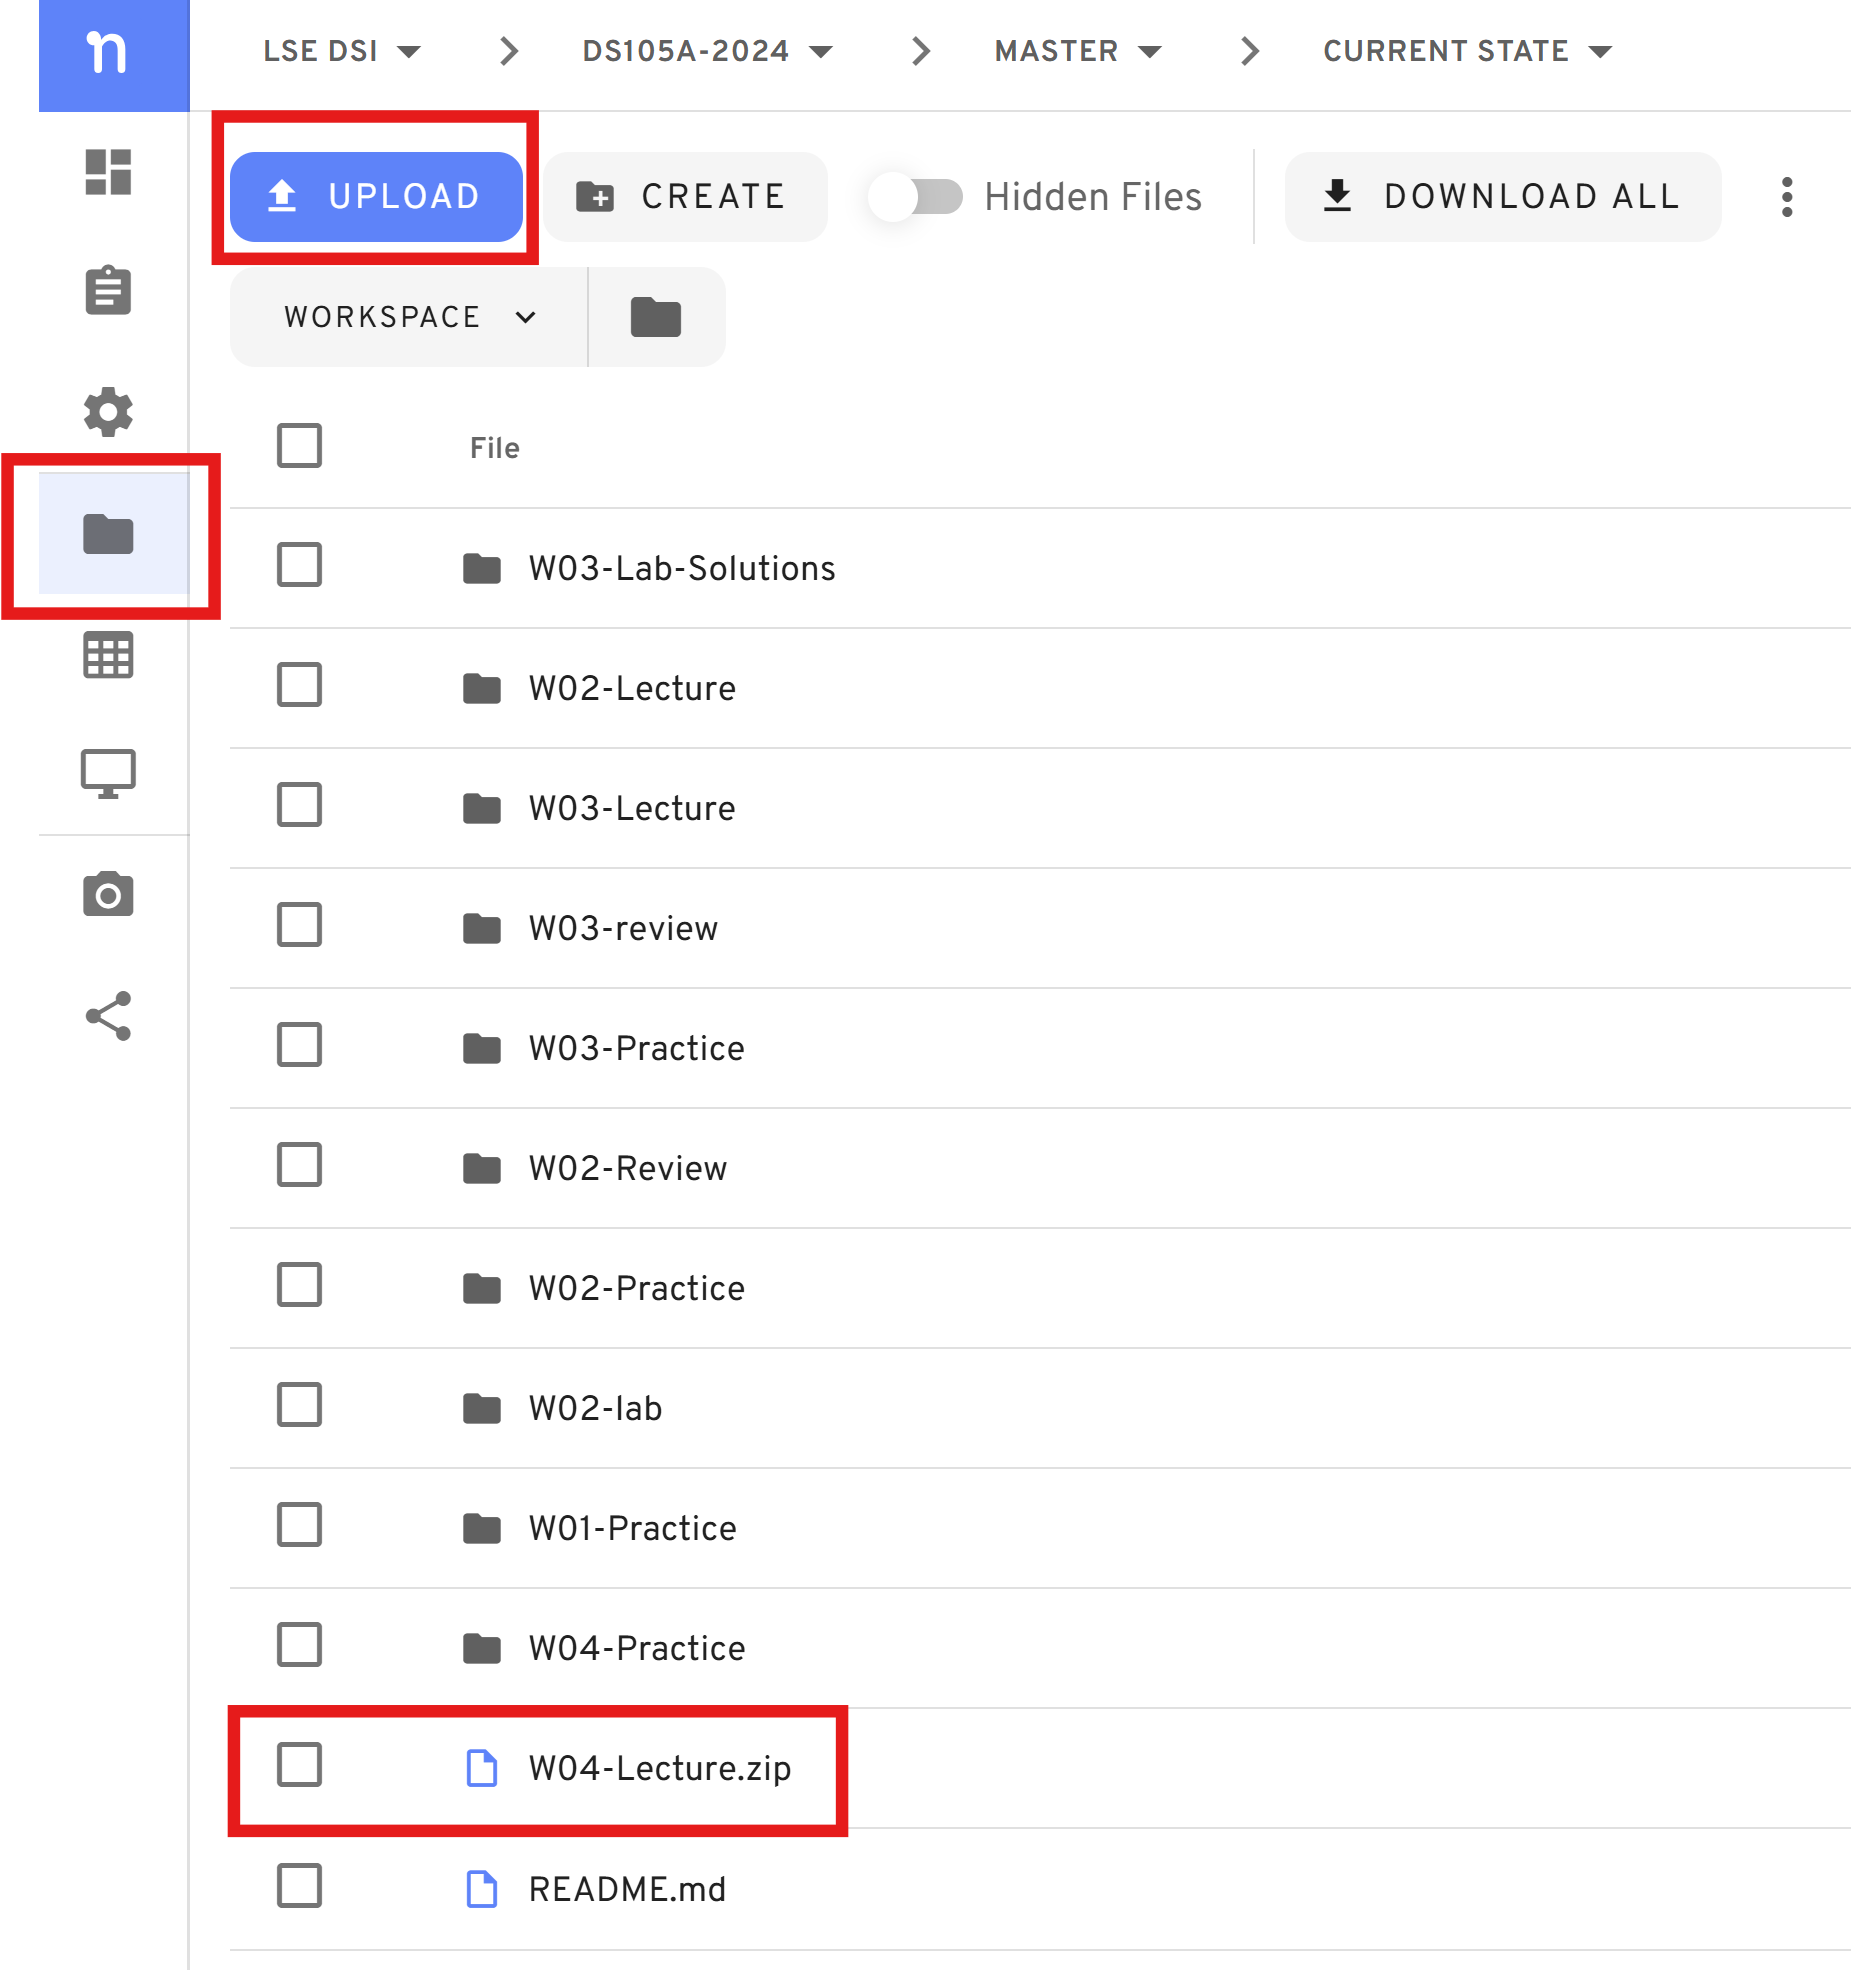
Figure 4. Upload the zip file to Nuvolos. - Then hover your mouse on top of the file and select ‘Extract All’.

Figure 5. Extract the zip file on Nuvolos. - If this creates a folder within a folder, you can organise it later with
mvcommands (don’t worry about it if you don’t have the time right now).
Open the folder on VS Code.
Create a new notebook at
W04-Lecture/code/NB00 - Preprocessing.ipynb.(Yes, we are taking one step back from where we started in the lecture.)
You should see the following project structure:
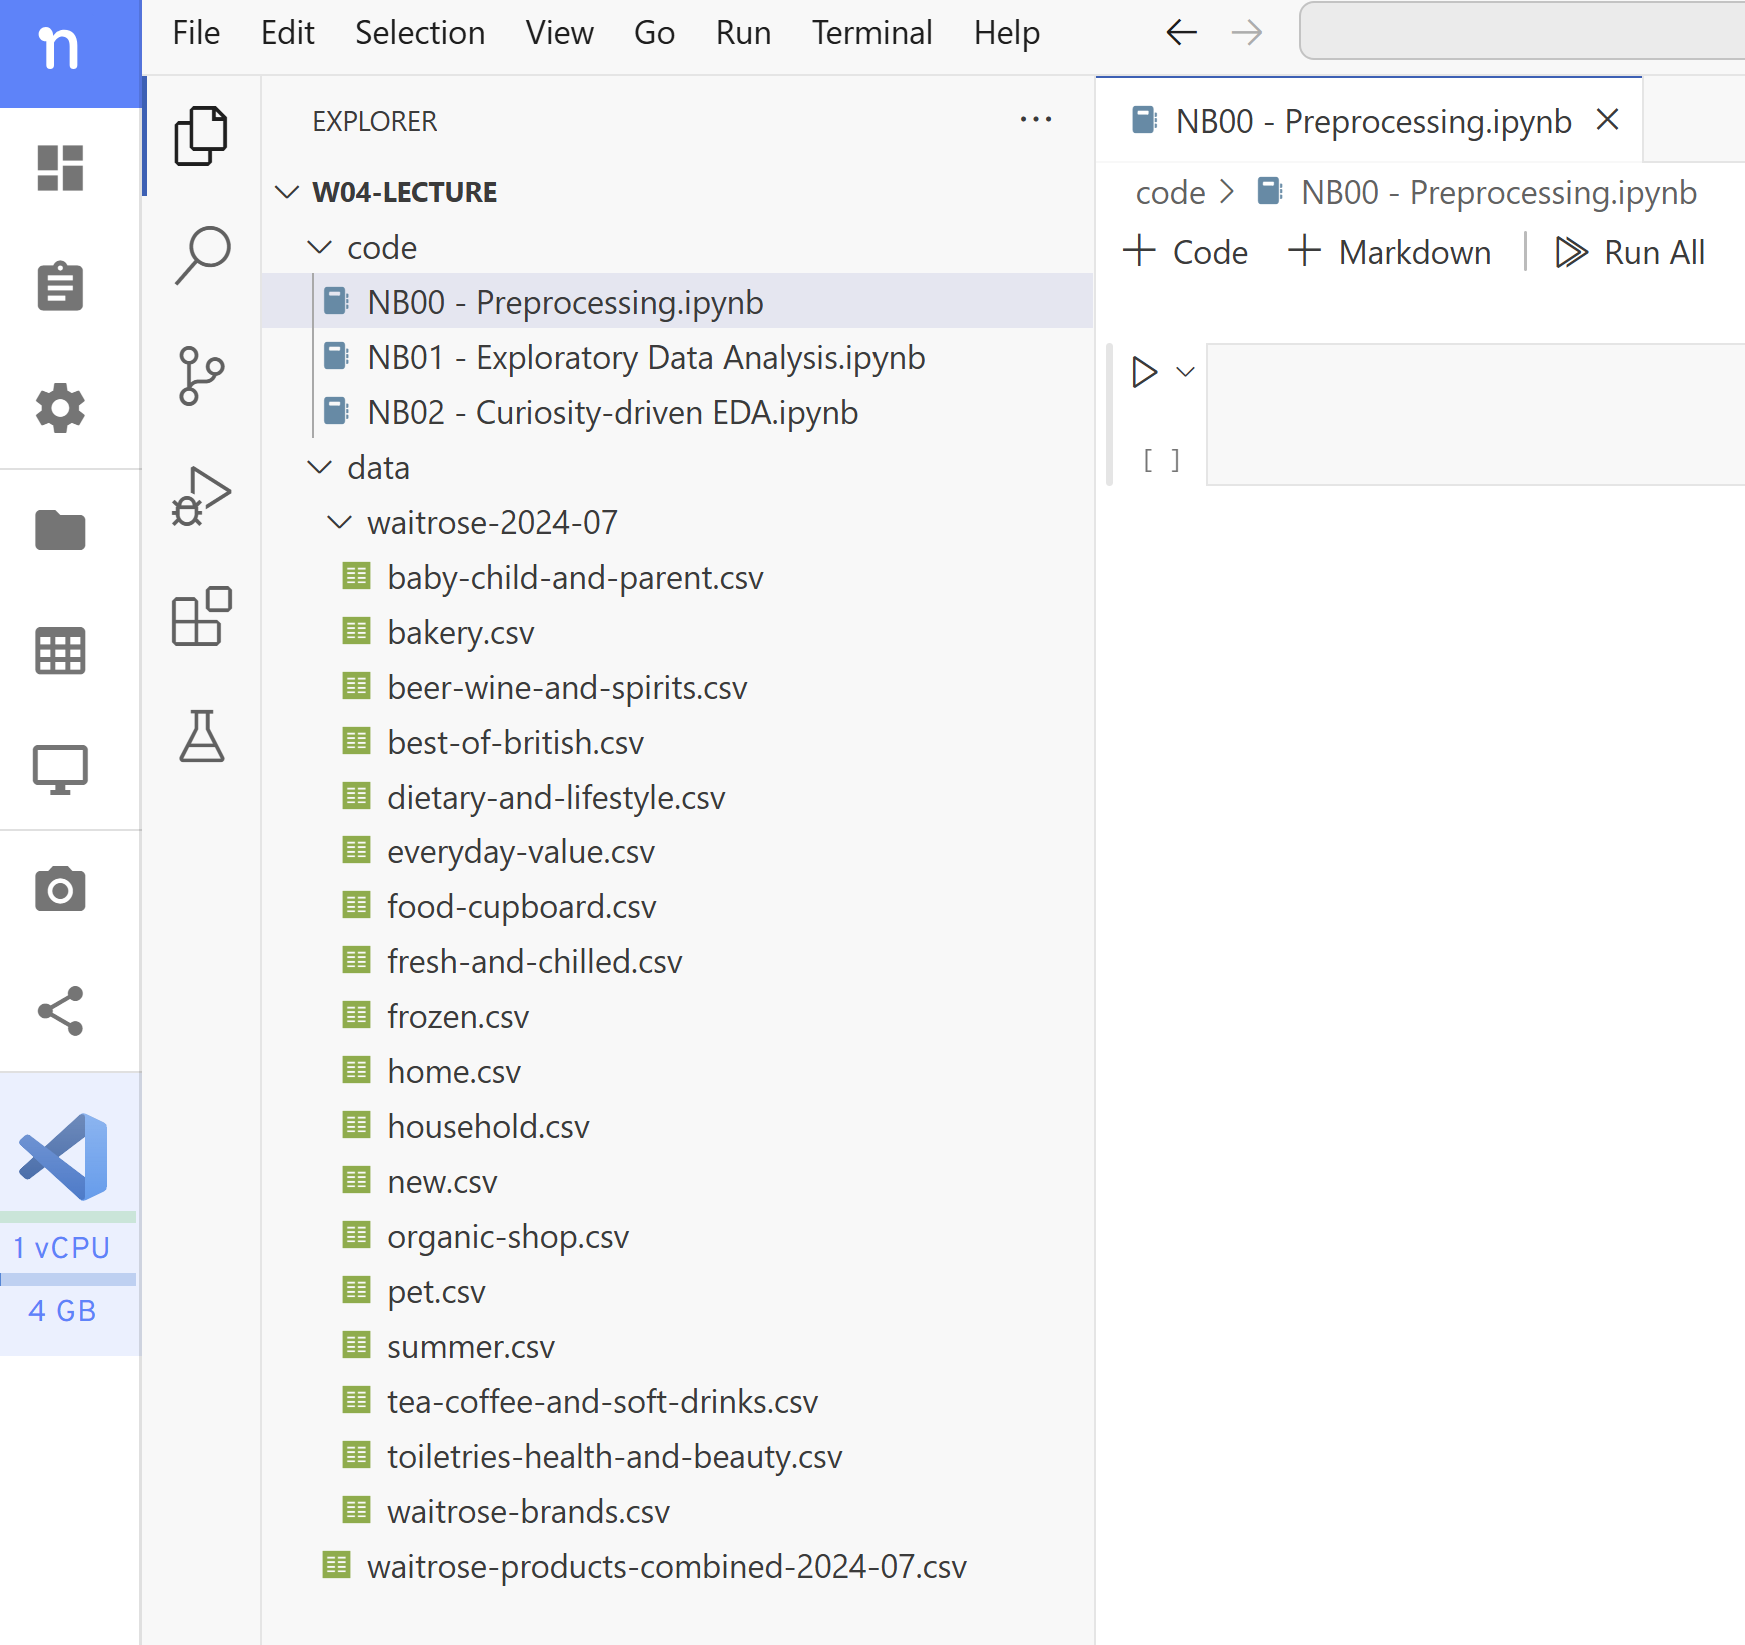
Figure 6. The contents of the W04-Lecture folder on VS Code plus the notebook NB00
Part II: Cleaning up the data (rest of the lab)
We have a couple of goals here:
🏆 TODAY’S CHALLENGES:
- Work with the original CSV files
- Convert the
item-pricecolumn of the original data from a string to a float - Check that your pre-processing worked by plotting the
item-pricecolumn per category - If time allows, clean up the
product-sizecolumn whenever it displays a range.
The point is not to get to the solution as quick as possible. Instead:
📋 Prioritise:
- Discussing the problem with your partner: how would you split the problem into smaller pieces?
- Thinking about the Python or pandas building blocks you could use to solve it.
- Figuring out the best immediate next step to take. Don’t try to solve everything at once.
Not all groups will be able to complete all of the puzzles below in the lab, so don’t worry if you are not progressing as fast as you would like. We will share the solutions with you at the end of the day and you can study from there and ask questions.
🦸 Your class teacher is equipped with the superpower of conflict mediation. Ask them for help if you are struggling to collaborate or if you feel stuck as a team.
🎯 ACTION POINTS:
👥 Together Negotiate the roles:
Ideally, the person less experienced or less confident with their programming skills should take the role of 🧑✈️ Pilot.
🙋 Copilot(s) should not take over if the Pilot is struggling to understand or follow a suggestion. The whole point of this activity is to figure out how to best express what you know and don’t know to others.
You can decide if and when you want to swap roles for the rest of the lab.
Starting Point
To make your life easier, here is the pandas code to read all the CSV files into a single DataFrame.
There are new Python features (list comprehension) and new pandas functions (pd.concat) that you might not have seen before. If you understand roughly what this code does, you are in a good place. Ask your class teacher if you have any questions about specific lines.
📜 Code to read all the CSV files
If you are reading this on Moodle and for some random reason, copying the code below is not working, visit the public website version of this page and copy the code from there.
# Identify the location of the original files
# This represents the path: ../data/waitrose-2024-07
data_folder = os.path.join('..', 'data', 'waitrose-2024-07')

# Use a list comprehension to get all the files in the folder
all_files = [os.path.join(data_folder, file) for file in os.listdir(data_folder)
             if file.endswith('.csv')]

# Print the list of files if you want to check
# print(all_files)

# Read every single file as a DataFrame
# Save the dataframes in a list
list_of_dfs = [pd.read_csv(file) for file in all_files]

# Use pd.concat to concatenate all the files into a single DataFrame
df = pd.concat(list_of_dfs)

# Check that we have all the data
df.info()
Puzzle 1: Explore the item-price column (20 min)
Don’t spend more than 20 min here. Jump to the solution if you exhausted the time.
🎯 ACTION POINTS:
🧑✈️ Pilot Create a new heading called ‘Exploring the
item-pricecolumn’.Then, the pilot creates a new cell and take a look at what’s inside the
item-pricecolumn.👥 Together Discuss the data.
Can we convert these strings straight away to floats?
- If yes, just convert it and you are done with this lab! You can scroll down to the plot and go home!
- If not, what type of data cleaning do we need to do?
🧑✈️ Pilot Write down a data cleaning strategy.
You can add a new markdown cell and place some bullet points with the type of cleaning you need to do. Then, discuss what is the best way to implement it.
🙋 Copilot(s): you can help to browse the
NB01, your own notes, or the pandas documentation or use AI to try and identify whichDataFrameorSeriesoperations could be useful here.🤖 To make good use of AI: remember to always give it A LOT of context! You need to provide a piece of what the data looks like, the type of problems in the column, what you know about Python/pandas and what you don’t know. Only then will you get recommendations that are truly useful for learning.
👥 Together Discuss validation strategies.
How would you know if your data cleaning worked? Write it down in a markdown cell.
✅ A solution for this part
Ideally you should have identified that the item-price column is full of non-numerial characters and that the prices are represented in four different ways:
- Some prices have a currency symbol at the beginning:
£1.99 - Others just have a
pat the end:99pto represent 99 pence - Some represent unitary prices:
£ 2.88 each est. - Some represent ranges:
£1.99 - £2.99
How would you know if your data cleaning worked?
A very simple way is to look at the ../data/waitrose-products-combined-2024-07.csv file and check if your new version of the item-price column looks exactly like the one in the file.
🤫 Here’s some code that could help you test that:
# Read the 'cleaned' file
df_cleaned = pd.read_csv('../data/waitrose-products-combined-2024-07.csv')

# The Series function equals() could help you here
df_cleaned['item-price'].equals(df['item-price'])
Another, more robust way is to convert the column to a float and check if the conversion worked:
# This should not raise an error
df['item-price'].astype(float)

# There should be no None or NaN values
df['item-price'].astype(float).isna().sum() == 0
Puzzle 2: Start with the £ situation
🎯 ACTION POINTS
🧑✈️ Pilot Add a function to clean up a price string
Add the skeleton of a function below to your notebook:
def clean_item_price(item_price: str):
    return item_price
This function is very silly right now. It just returns the same string you pass to it. But it’s a good starting point.
💡 Tip: Test the function with just ONE string:
clean_item_price('£1.99') # or clean_item_price('£ 2.88 each est.')🧑✈️ Pilot Test the function with
Series.apply():- 🙋 Copilot(s): find out how to apply a custom function to an entire column in one line.
🧑✈️ Pilot Modify the function to treat the simplest of the four data cleaning scenarios. That is, figure out what to write in the function to convert strings that have the pound sign on the left,
£ 2.00.Your function should still return a string, but a clean one that looks like a float.
- 🙋 Copilot(s): remind the pilot to test the function with individual values first before using the
apply()method.
- 🙋 Copilot(s): remind the pilot to test the function with individual values first before using the
Puzzle 3: The p situation
Keep going with the same function, this time add code to treat cases where the price is represented in pence.
Puzzle 4: The each situation
Keep going with the same function, this time add code to treat cases where the price is represented in unitary prices.
Puzzle 5: The range situation
Keep going with the same function, this time add code to treat cases where the price is represented in ranges.
💭 Think about it: do your modifications to the item-price column have repercussions for other columns in the DataFrame?
📊 Plotting the data
If, and only if, you managed to create a good clean_item_price() function, you can now convert the item-price column to a float and run the code below to investigate how much each category costs on average (here we are using the median price to represent an average).
By the way, the code below requires the following imports:
from lets_plot import *
LetsPlot.setup_html()
📊 Code to compare prices per category
If you are reading this on Moodle and for some random reason, copying the code below is not working, visit the public website version of this page and copy the code from there.
plot_df = (
    df.groupby('category')['item-price'].describe()
        .reset_index()
        .rename(columns={'25%': 'Q1', '50%': 'median', '75%': 'Q3'})
        .sort_values(by='median')
)

# plot_df.head() to see how it looks like

# This configures what shows up when you hover your mouse over the plot.
tooltip_setup = (
    layer_tooltips()
        .line('@category')
        .line('[@Q1 -- @median -- @Q3]')
        .format('@Q1', '£ {.2f}')
        .format('@median', '£ {.2f}')
        .format('@Q3', '£ {.2f}')
)

g = (
    # Maps the columns to the aesthetics of the plot.
    ggplot(plot_df, aes(y='category', x='median', xmin='Q1', xmax='Q3', fill='category')) +

    # GEOMS

    # Add a line range that 'listens to' columns informed in `ymin` and `ymax` aesthetics
    geom_linerange(size=1, alpha=0.75, tooltips=tooltip_setup) +

    # Add points to the plot (listen to `x` and `y` and fill aesthetics)
    geom_point(size=3, stroke=1, shape=21, tooltips=tooltip_setup) +

    # SCALES

    # Remove the legend (we can already read the categories from the y-axis)
    scale_fill_discrete(guide='none') +

    # Specify names for the axes
    scale_y_continuous(name="Categories\n(from largest to smallest median)", expand=[0.05, 0.05]) +
    scale_x_continuous(name="Price (£)", expand=[0., 0.05], format='£ {.2f}', breaks=np.arange(0, 20, 2.5)) +

    # LABELS
    # It's nice when the plot tells you the key takeaways
    labs(title='"Beer, Wine & Spirits" has the highest median price for individual items',
         subtitle="Dots represent the median price, bars represent the 25th and 75th percentiles") +
    theme(axis_text_x=element_text(size=15),
        axis_text_y=element_text(size=17),
        axis_title_x=element_text(size=20),
        axis_title_y=element_text(size=20),
        plot_title=element_text(size=19, face='bold'),
        plot_subtitle=element_text(size=18),
        legend_position='none') +
    ggsize(1000, 500)

)

g