
🧑🏫 Week 01 Lecture
Course Logistics & Introduction to Data Science Tools
Welcome to our very first lecture! 🎉
Below, you will find the schedule, as well as the written notes for the lecture.
📃 Schedule
📍Location: Thursday 3 October 2024, 4 pm - 6 pm at CLM.5.02
⚠️ The location changed to CLM.5.02!
This first lecture will have two parts:
Course Logistics. (4 pm - 5 pm) Here, we will go over the ℹ️ Course Information together. We will discuss the structure of the course, the teaching philosophy,the topics we will cover each week, how you will be assessed, how to contact us, how to get help, as well as the course policy on the use of Generative AI tools.
Introduction to Data Science Tools. (5 pm - 6 pm) In this part, I will describe the main tools used in professional data science projects (Python, Jupyter Notebooks, Terminal, Git, and more). We will also revisit the concepts covered in the 📝 W01 Formative Exercise and connect them to what’s to come next week.
📋 Preparation
At DS105, we don’t think teaching is restricted to the classroom. We believe learning happens anytime, anywhere, and that frequent human-to-human communication is key to a successful learning experience.
Our lectures are one place where that communication happens. More than just getting new information, this is the place to consolidate your understanding of the self-study material we shared with you by asking questions and engaging in discussions.
The best way to come prepared for this first one is to browse the two links below:
Visit the course info page to read everything you need to know about the course, including the topics we will cover each week, how you will be assessed, how to contact us, how to get help, and the course policies.
Bring your questions to the lecture!
Completing the exercise will help you arrive well-prepared for the first lecture. This session will be most effective if you have already attempted the exercise and have questions about it.
In particular, what was most confusing/challenging about this exercise?
📝 Lecture Notes
📋 TAKE NOTE:
You won’t find “slides for studying” in this course. I do use slides in my lectures, but they serve as a visual aid to help me organise my thoughts.
The studying material is in the written notes below.
Let me know if you want me to add notes on any specific topic or expand on something you might want to revisit later.
The lecture covered two main topics. Scroll down to find the notes for each one.
TOPIC 1: A Typical Data Science Workflow
When you work with data, you usually follow a process that goes from gathering data to communicating insights (or deploying a data-driven solution). This process is definitely not linear, you will find yourself going back and forth between steps, but if it helps to think of it as a sequence of steps, you can think of it as follows:
Where to find wild data?
Many countries, organisations and researchers offer their data for free to the public. For example, you can find a lot of data to download on these websites:
- UK Government Data
- US Government Data
- Australian Government Data
- World Bank Data
- Google Dataset Search
However, very frequently, you need to collect your own data. This can be done by:
- APIs: Many websites offer Application Programming Interfaces (APIs), tools that allow you to download data directly from their servers. The API maintainer will typically provide documentation and specify how you can access the data and, importantly, how much you can download.
⚠️ Warning: APIs can be a business model for some companies. They might charge you for access to their data.
- Web scraping: Extracting data directly from websites (e.g., Wikipedia)
⚠️ Warning: Never collect personal data! It is inappropriate and against the law in many countries. For example, the Data Protection Act 2018, the UK’s version of the European legislation General Data Protection Regulation (GDPR), regulates the collection and processing of personal data.
Private databases: Organisations usually have a large amount of data stored in their internal databases. If you are employed by or working at an organisation and have the necessary permissions, you can directly access these databases and retrieve the data.
Logs: Many apps you use keep logs of your activity (think of your browser history or the number of steps you took today). You can treat those logs as data and analyse them.
Surveys: These are a common way to collect data in social sciences.You can create surveys and collect data from people. Surveys alone are often not enough to make generalisations about a population, but they can be a good starting point and you can combine them with other data sources.
Sensors: Many devices have sensors that collect data. For example, your phone has a GPS sensor that tracks your location.
How we gather & store data
When I talk about “gathering data,” I mean reading data from a chosen source before storing or analysing it, whereas storing data refers to saving such data to a file. Under this scenario, when you gather data (without storing) using the Terminal or Python but haven’t saved it anywhere, the data will disappear if you close the Terminal or Python shell.
Sometimes, you don’t need to gather data because the data you collected already comes in a file. In this case, you just need to read it.
All of the above will become clearer once we start collecting data on 💻 Week 02 Lab and later in 👨🏻🏫 Week 07 Lecture.
One could say there are three main ways to think about how we gather and store data:
- APIs & Websites: You can use the
curlcommand in the Terminal or therequestslibrary in Python to download data from the web.
📋 NOTE:
- We will play with
curlin 💻 Week 02 Lab next week. - We will probably study APIs and learn about the
requestslibrary in 👨🏻🏫 Week 07 Lecture.
- Plain text files: If your data comes from a software (a log file, for example), or you downloaded it from a website, it is probably stored in a file. Alternatively, when you collect the data from the Internet, it is always a good idea to store it in a file that you can read later.
You can use Python’s standard open() function to read data from files 1. Still, if the data is in a more structured format, you might prefer to use the pandas library in Python.
There are many standards for storing data in files, and the most common ones are TXT (plain text), CSV (Comma Separated Values)2, and JSON (JavaScript Object Notation).
📋 NOTE: We will start to use the pandas library in the 👨🏻🏫 Week 03 Lecture once we are confident with our Terminal + basic Python skills.
- Databases: There are many libraries in Python that allow you to connect to databases. The most robust and popular one that caters to a wide range of databases is the
SQLAlchemylibrary, but sometimes you might need to use a more specific library for a specific database.
📋 NOTE: We will study databases later, in the 👨🏻🏫 Week 08 Lecture
How we clean & pre-process data
Even when your data is stored somewhere, you will find that no matter how organised you were when you collected it, it will always need some cleaning and pre-processing.
Cleaning data is the process of removing or correcting errors in the data. This can be as simple as removing a row with missing data or as complex as correcting the spelling of a word in a text.
Pre-processing data, on the other hand, refers to transforming the data into a format more suitable for analysis. For example, sometimes, we need to remove some columns from a dataset, normalise the data so that all the columns have the same scale, or transform the data to make visualisation easier.
⭐️ In this course, we focus a lot of energy on this stage. ⭐️
We will learn to clean and pre-process data efficiently using Python and the pandas library.
How we build a dataset
You might not know yet, but even after you have cleaned and pre-processed it, your data might not be in an easy-to-analyse format. A convention called tidy data makes it easier to analyse data across different programming languages and tools.
⭐️ Creating tidy datasets is another fundamental aspect of this course. ⭐️
We will learn how to build tidy datasets using Python and the pandas library, starting in the 👨🏻🏫 Week 03 Lecture.
Eventually, you will learn how to save your (tidy) data to a database. We will explore the SQLite database, starting on 👨🏻🏫 Week 08 Lecture.
How we do exploratory data analysis (EDA) & collect insights
Exploratory Data Analysis (EDA) is the process of analysing data to summarise its main characteristics. In this course, we will take a curiosity-driven approach that is more visual than mathematical. It will be closer to data journalism than to statistics. Our focus is not machine learning but understanding our data and communicating what we see to others. We won’t teach, for example, hypothesis testing or statistical inference.
The default Python library for EDA is pandas, but specifically when it comes to data visualisation, a popular choice are the matplotlib and seaborn libraries.
👉 IMPORTANT! In this course, we will go rogue! Instead of those two popular choices, we will teach you a bit about the programming language R and the popular ggplot package. We won’t stay with R, but all the visualisations you create in this course will have to be made using the lets-plot package, a Python version of ggplot in R.
By “collecting insights,” we mean confirming what we suspected about the data, discovering new patterns, finding outliers, and understanding how different variables relate to each other. It’s more of an art and a craft than a science. We’ll first discuss this in the 👨🏻🏫 Week 03 Lecture, but insight discovery and curiosity-driven analysis will be constant throughout the course.
How we do machine learning
Machine Learning and statistical inference comprise a set of tools that allow you to make inferences and predictions based on data using algorithms. This is a very exciting part of data science, but it is outside the scope of this course. You might want to check our sister course, DS202 - Data Science for Social Scientists, where we cover the fundamentals of machine learning. For the record, in Python, the most popular library for machine learning is scikit-learn.
How we communicate results
This is the final step of a data science project cycle. You’ve found something interesting in your data and need to spread the word. This can be done in many ways, but the most common ones are:
Reports and presentations: Rather than writing
.docxfiles, we will teach you how to write reports in Markdown-powered documents using Jupyter Notebooks or websites.Dashboards: You can create a dashboard with your findings. We will teach you how to create dashboards using the
streamlitlibrary in Python on the 👨🏻🏫 Week 10 Lecture.
We will also try to give you some tips on how to tailor your charts and reports to different audiences.
TOPIC 2: Making sense of files and folders
It’s really important to understand how to navigate your computer’s folders and files using paths and directories. Even if you’re great at Python, using pandas, databases, and visualisations, you’ll still struggle, and you won’t understand why if you don’t know your way around your computer’s file system and how paths to files and directories work. Understanding how data and files are stored on your computer is key to working effectively with them.
To truly master programming, learn how to master the command line first! ![]()
This is why on Week 01 & 02 we will focus on practising the use of the Terminal (I might sprinkle a few Python commands here and there, but the focus is still on the Terminal). If you did the 📝 W01 Formative Exercise, you already have an idea about what I’m talking about, but let’s go through it step-by-step.
Let me start from the beginning:
What is an Operating System?
To fully understand the Terminal, you need to understand what an Operating System is. An Operating System is THE main piece of code that runs on your computer that manages what you see on the screen, what you can do with the keyboard and mouse, and how you can interact with the hardware. The Operating System (OS) is the one that sends commands to the hardware on your behalf, whenever you click on a file, or do something on an app in your computer.
It will help to think of a computer as a system made up of these parts:
- hardware: provides the basic computing resources for the system
- application programs: define how these resources are used
- operating system: controls the hardware and coordinates its use among the various application programs for the various users
- user: a person or a bot (a computer script) that requests actions from the computer.
Typically, these components interact in a layered way, with the user at the top, the application programs in the middle, and the operating system at the bottom:
Why bother with this?

Image created with DALL·E via Bing Chat AI bot. Prompt: “a gigantic wooden question mark looms above the big ben, ultra-realistic awesome painting”
- It is improbable you will ever need to interact with the kernel directly.
- But, we often need to install custom software to perform some data analysis
- This software might not come from Apple or Microsoft Store.
- Those are things you have to install “manually.”
Common Operating Systems
The most common Operating Systems are:
 Windows: the most popular OS for personal computers worldwide.
 macOS: the Operating System of Apple computers.
 Linux (and its many distributions). It is what YOU will use next week when we access the Nuvolos Cloud Platform.
A few brief notes about the popular Operating Systems:
GNU/Linux
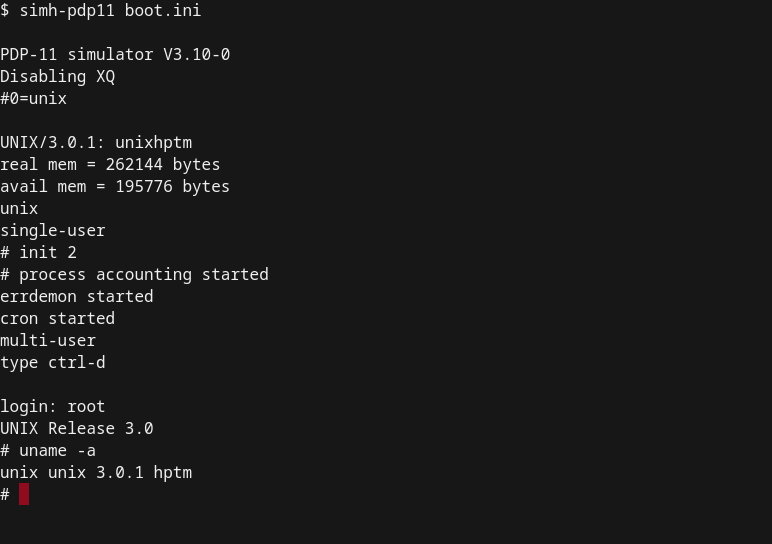
Linux and macOS share a common ancestor: an old operating system called UNIX. Back in the 70s, UNIX was the Operating System of choice for many universities and research institutions. When you interact with the Terminal today, you probably feel like how it was to operate a UNIX system back in the 70s when the notion of a graphical user interface was still a dream.
UNIX was a proprietary system 🤑, and many people wanted to have a free version of it. This led to the birth of one of the most influential operating systems: GNU/Linux, or simply Linux. Although Linux is not used a lot in personal computers or laptops, it is the preferred OS for cloud based applications, including for data science.
🔗 Learn more about Linux: RedHat - Understanding Linux
![]() Android, the most popular OS for phones worldwide, is based on Linux!
Android, the most popular OS for phones worldwide, is based on Linux!
macOS
- macOS is the Operating System of Apple computers
- It is a hybrid system. It has a free, open-source component called Darwin, but it also includes proprietary, closed-source components.
- iOS, Apple’s mobile operating system, is also based on Darwin
- Darwin is based on BDS UNIX, a derivative of the original UNIX system.
Windows
- Windows has its own history.
- Microsoft and IBM co-developed its predecessor, the OS/2 operating system.
- But then, Microsoft took on its own path and developed its own versions of the OS: Windows NT, Windows 95, Windows 98, Windows 2000, Windows XP, Windows 7, Windows Vista*, etc.
- Windows popularity can be traced to the success of the Office suite

Files & Filesystems

Image created with DALL·E via Bing Chat AI bot. Prompt: “robots sorting and shelving physical files in folders. Circular tables, white room, pops of color, modern, cosy, clean flat design”
- Ultimately, everything in a computer is just a bunch of
0s and1s - Files are a set of conventions that allows us to extract information from them.
- A directory, or folder, is a place where many files are stored. It is a way to organise files.
- Think of them as shelves 🗄️
Files are stored in a hierarchical structure called a filesystem. This structure is similar to a tree, with the root directory 3 at the top, and subdirectories branching out from it.
This kind of hierarchical structure is present in all modern Operating Systems (Windows, MacOs, Linux, etc.). In theory, it can contain infinite sub-directories and files.
The UNIX directory tree
In MacOS as well as in Linux, the directory structure typically looks like this (scroll to the right to see the full tree):
On Windows, although there is a hierarchical structure, it is very different from the UNIX structure. Windows has a drive letter system, where each drive is a separate filesystem. The most common drives are C:\, D:\, E:\, etc. Here is what a typical Windows filesystem looks like (starting from the C:\ drive):
Can we get back to the Terminal?
A terminal, or command prompt or the command line is a screen or a window that serves as a very close window to the core of your computer. It is a text-based interface to the computer. There are no graphics (images/video) in the terminal, only text.
👉 Instead of the usual click-and-drag way of using the computer, you have to type a command to change to directories, another for opening a file, another for moving a file, etc.
Crucially, you need to know what to type! Clicking randomly to see what happens won’t work.

Shell
Typically, the Terminal runs a program (app) called the shell. Sometimes I will use the terms interchangeably, but if we were to be pedantic, the Terminal is the window, and the shell is the program that runs inside it.
The shell awaits, interprets, processes, executes, and responds to commands typed in by the user.
There are many shells, each has its own features. Here are some popular Linux shells:
shor the Bourne shell: developed at AT&T labs in the 70s by a guy named Stephen Bourne.bashor the Bourne again shell: very popular, compatible withshshell scripts.- Our 🖥️ labs will focus on
bash kshor the Korn shell: provides enhancements over theshand it is also compatible withbash.cshandtcsh: shells that have a syntax similar to the programming languageC.
👉 IMPORTANT! Next week, everyone will use the bash shell on our Nuvolos Cloud Platform.
Windows CMD vs PowerShell
Windows has its own thing going on. There are two main shells on Windows these days:
- CMD: the old shell, that is still around for compatibility reasons.
- Powershell: the new shell, that is more powerful and has more features.
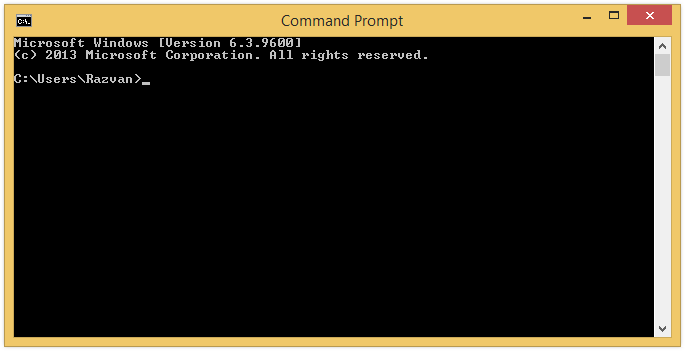
Although we do give support to PowerShell in this course, we will focus on bash in the labs, as it is the most common shell in the Linux world.
Now what?
Well, the actual usage of the Terminal is a bit more complex than what I can explain here. The best way to learn the commands is with practice, so I recommend doing (or revisiting) the 📝 W01 Formative Exercise.
Footnotes
more on that in the upcoming 📝 W02 Formative Practice↩︎
more on that in the upcoming 📝 W02 Formative Practice↩︎
Remember that from 📝W01 Formative Exercise?↩︎