
💻 Lab 02 – Tidying up tabular data
Week 01 – Day 02 - Lab Roadmap (90 min)
🗒️ The Brief
We will revisit the data frame we used yesterday and try to clean it up and modify it a bit. We will also learn how to run the scripts as opposed to typing the code in the console.
📋 Lab Tasks
Feel free to get started on the following tasks as soon as you enter the lab.
Part I: Setting Up (15 min)
🎯 ACTION POINTS:
- Create a new script file for today’s lab under the
codefolder.
 (VS Code)
Open VS Code and ensure you are on the correct Working Directory
Create a new Python file by clicking on the
File>New Filemenu option (see image below).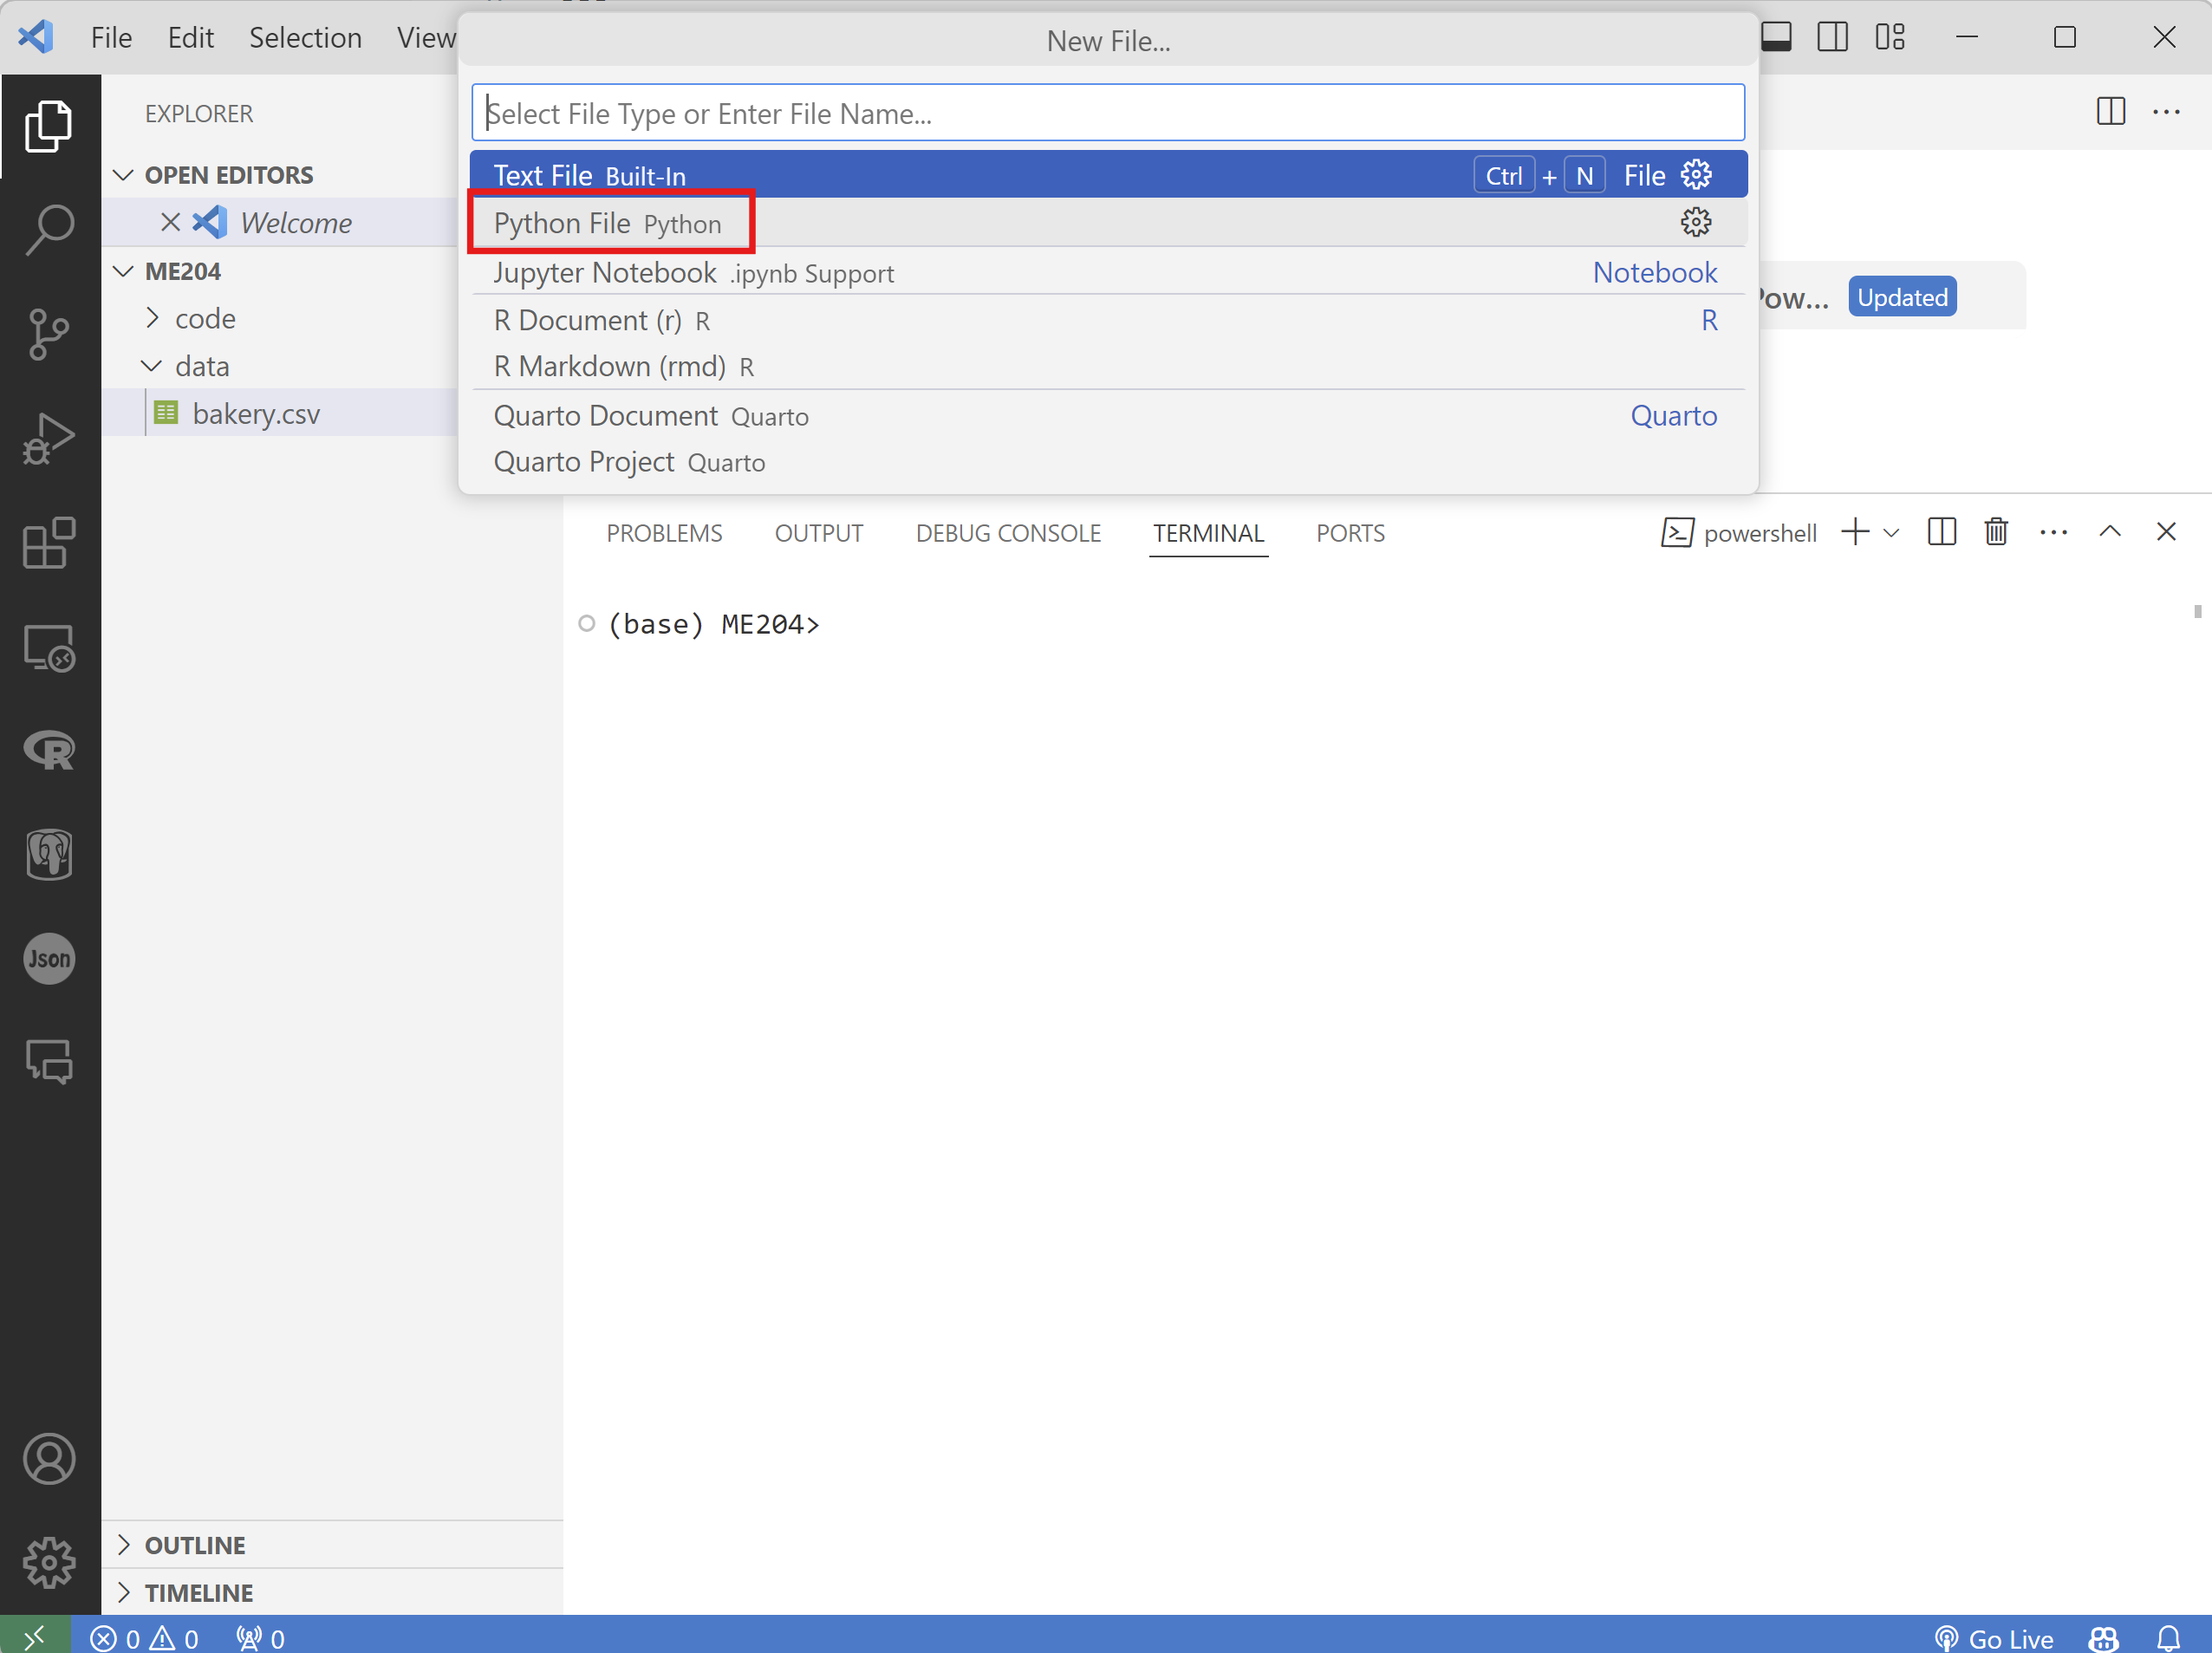
Add the following code snippet to the new file:
import pandas as pd

df = pd.read_csv('./data/bakery.csv')

selected_columns = ['data-product-id', 'data-product-name', 'data-product-on-offer', 'item-price']

print(df[selected_columns])
📝 NOTE: The
./represents the current folder (directory) from where the script is being run. This corresponds to your working directory.Save the file by clicking on
File>Saveoption or by pressingCtrl + Son your keyboard.VERY IMPORTANT: Save the file to the
ME204/codefolder with the following nameweek01-lab02.py. The image below shows the example for Windows, but the process is similar for Mac.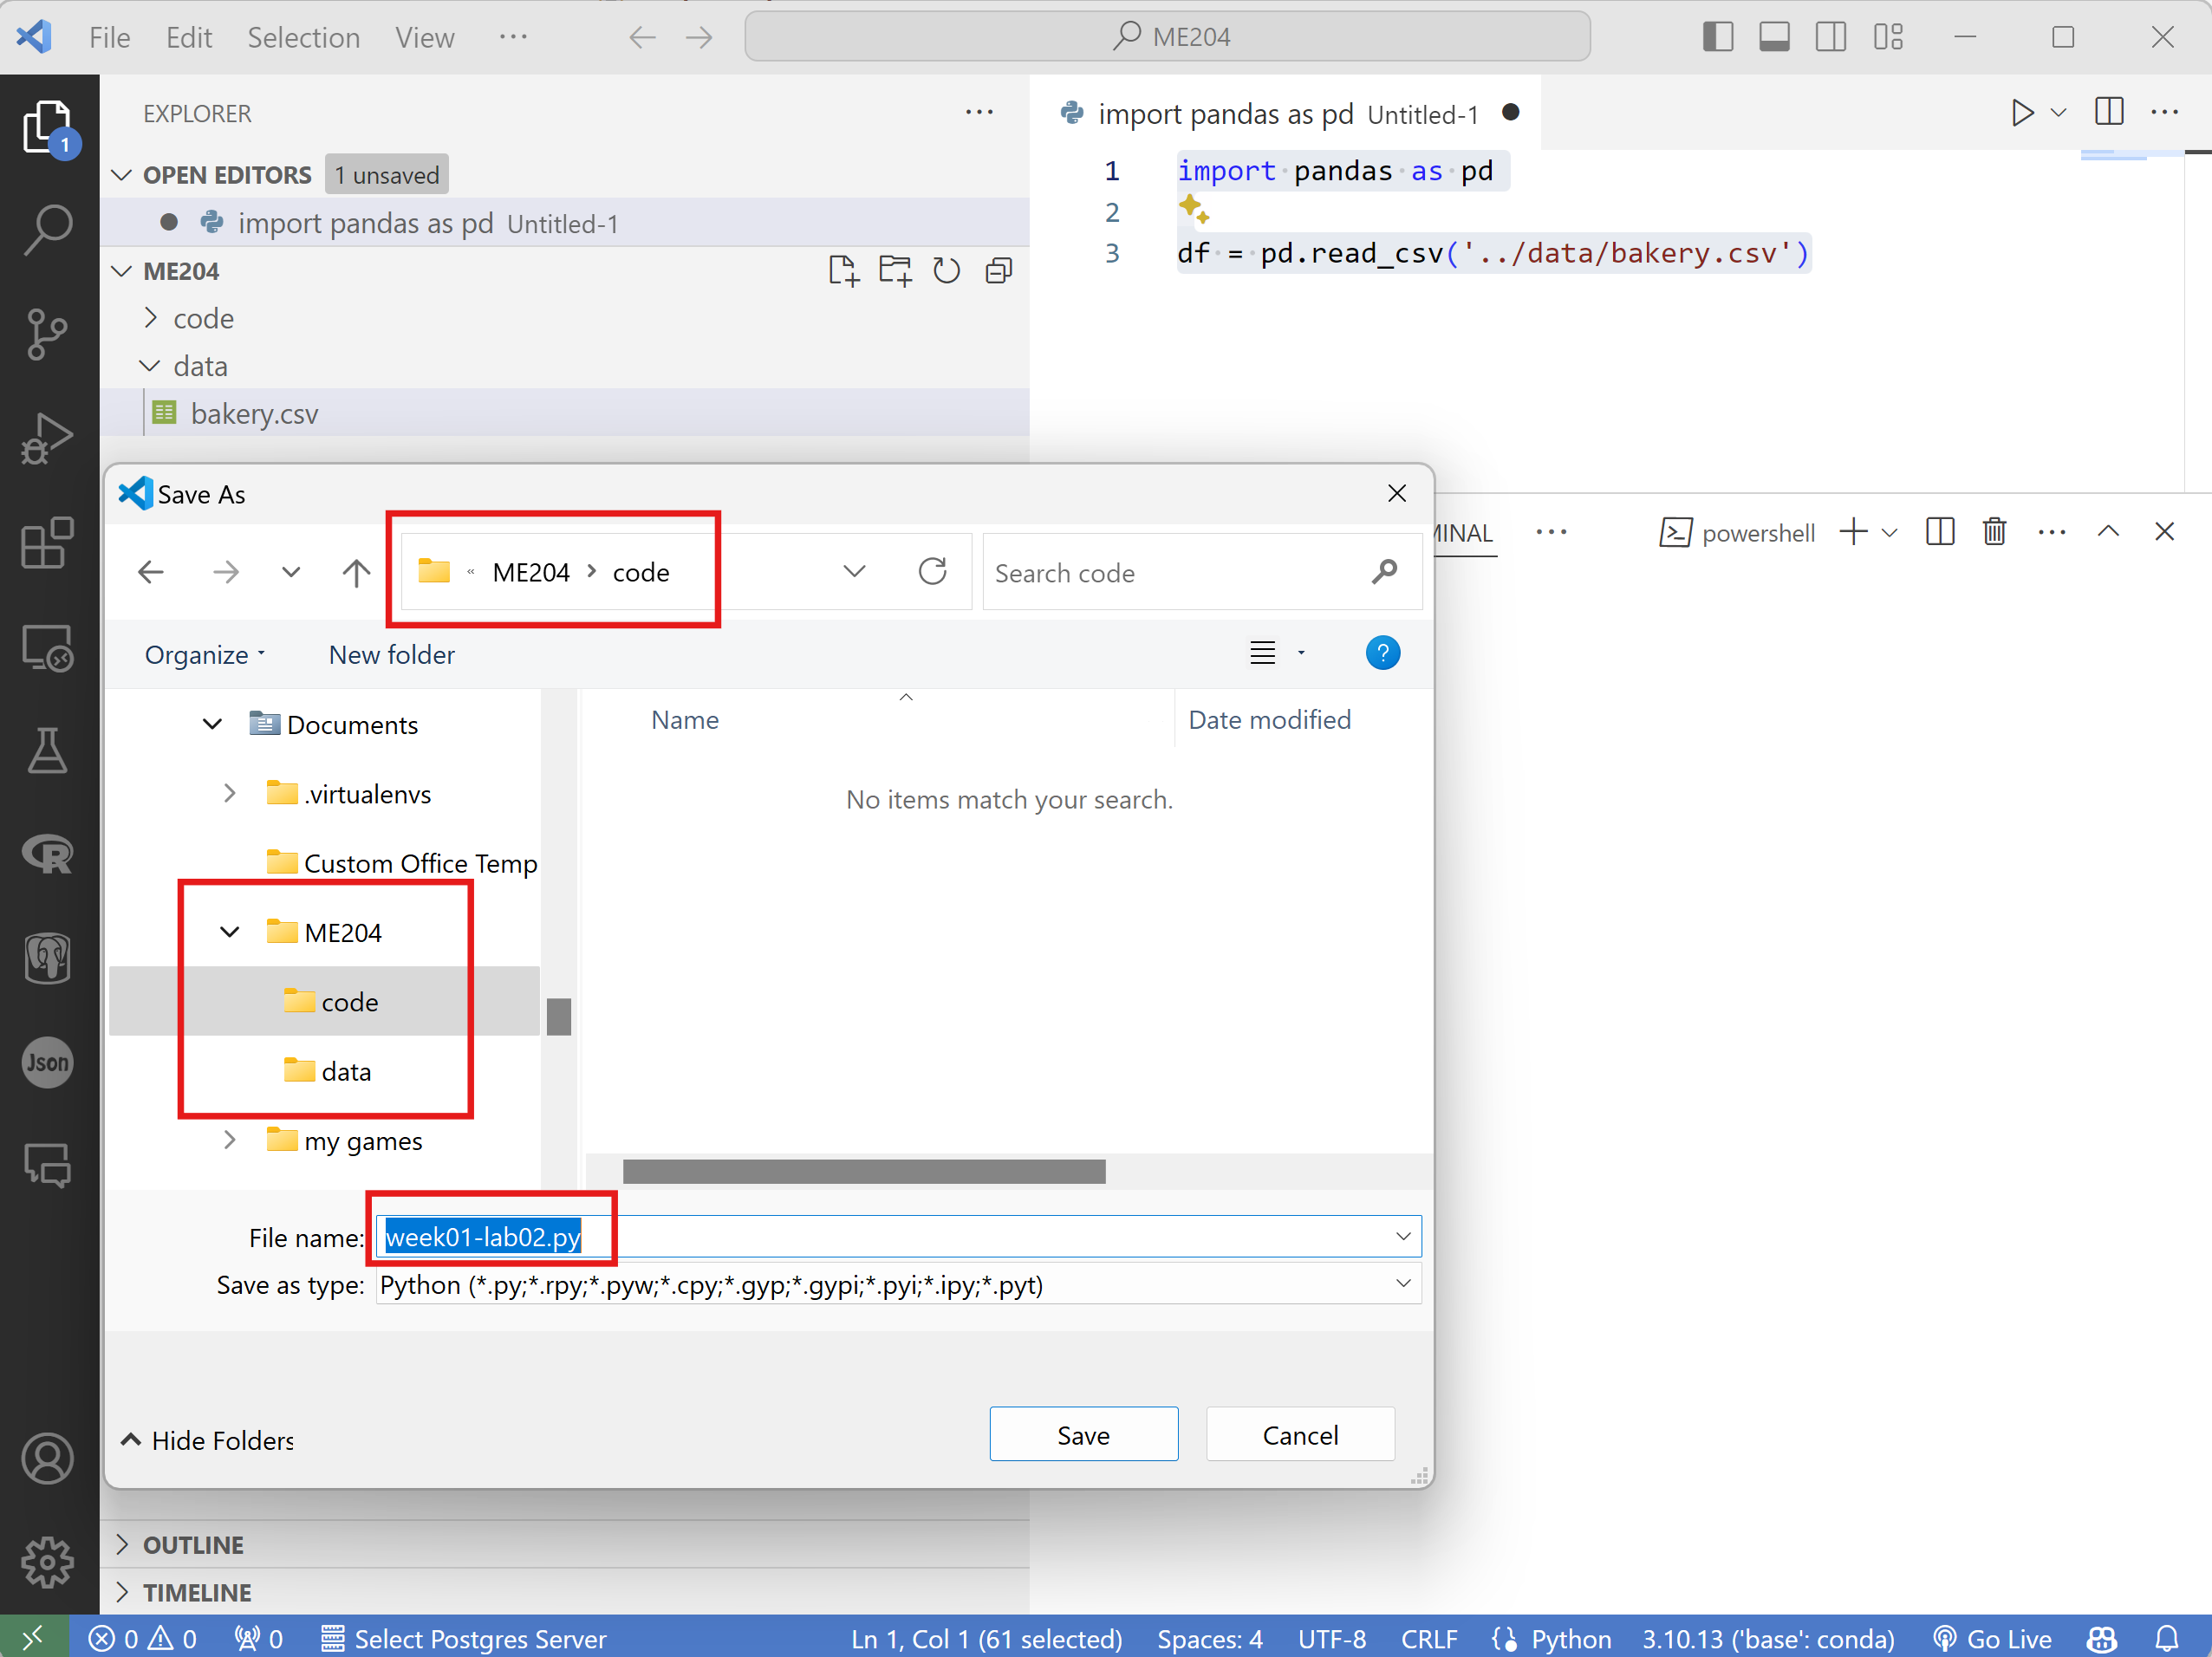
 (RStudio)
Open RStudio and ensure you are on the correct Working Directory
Create a new R script file by clicking on the
File>New File>R Scriptmenu option (see image below).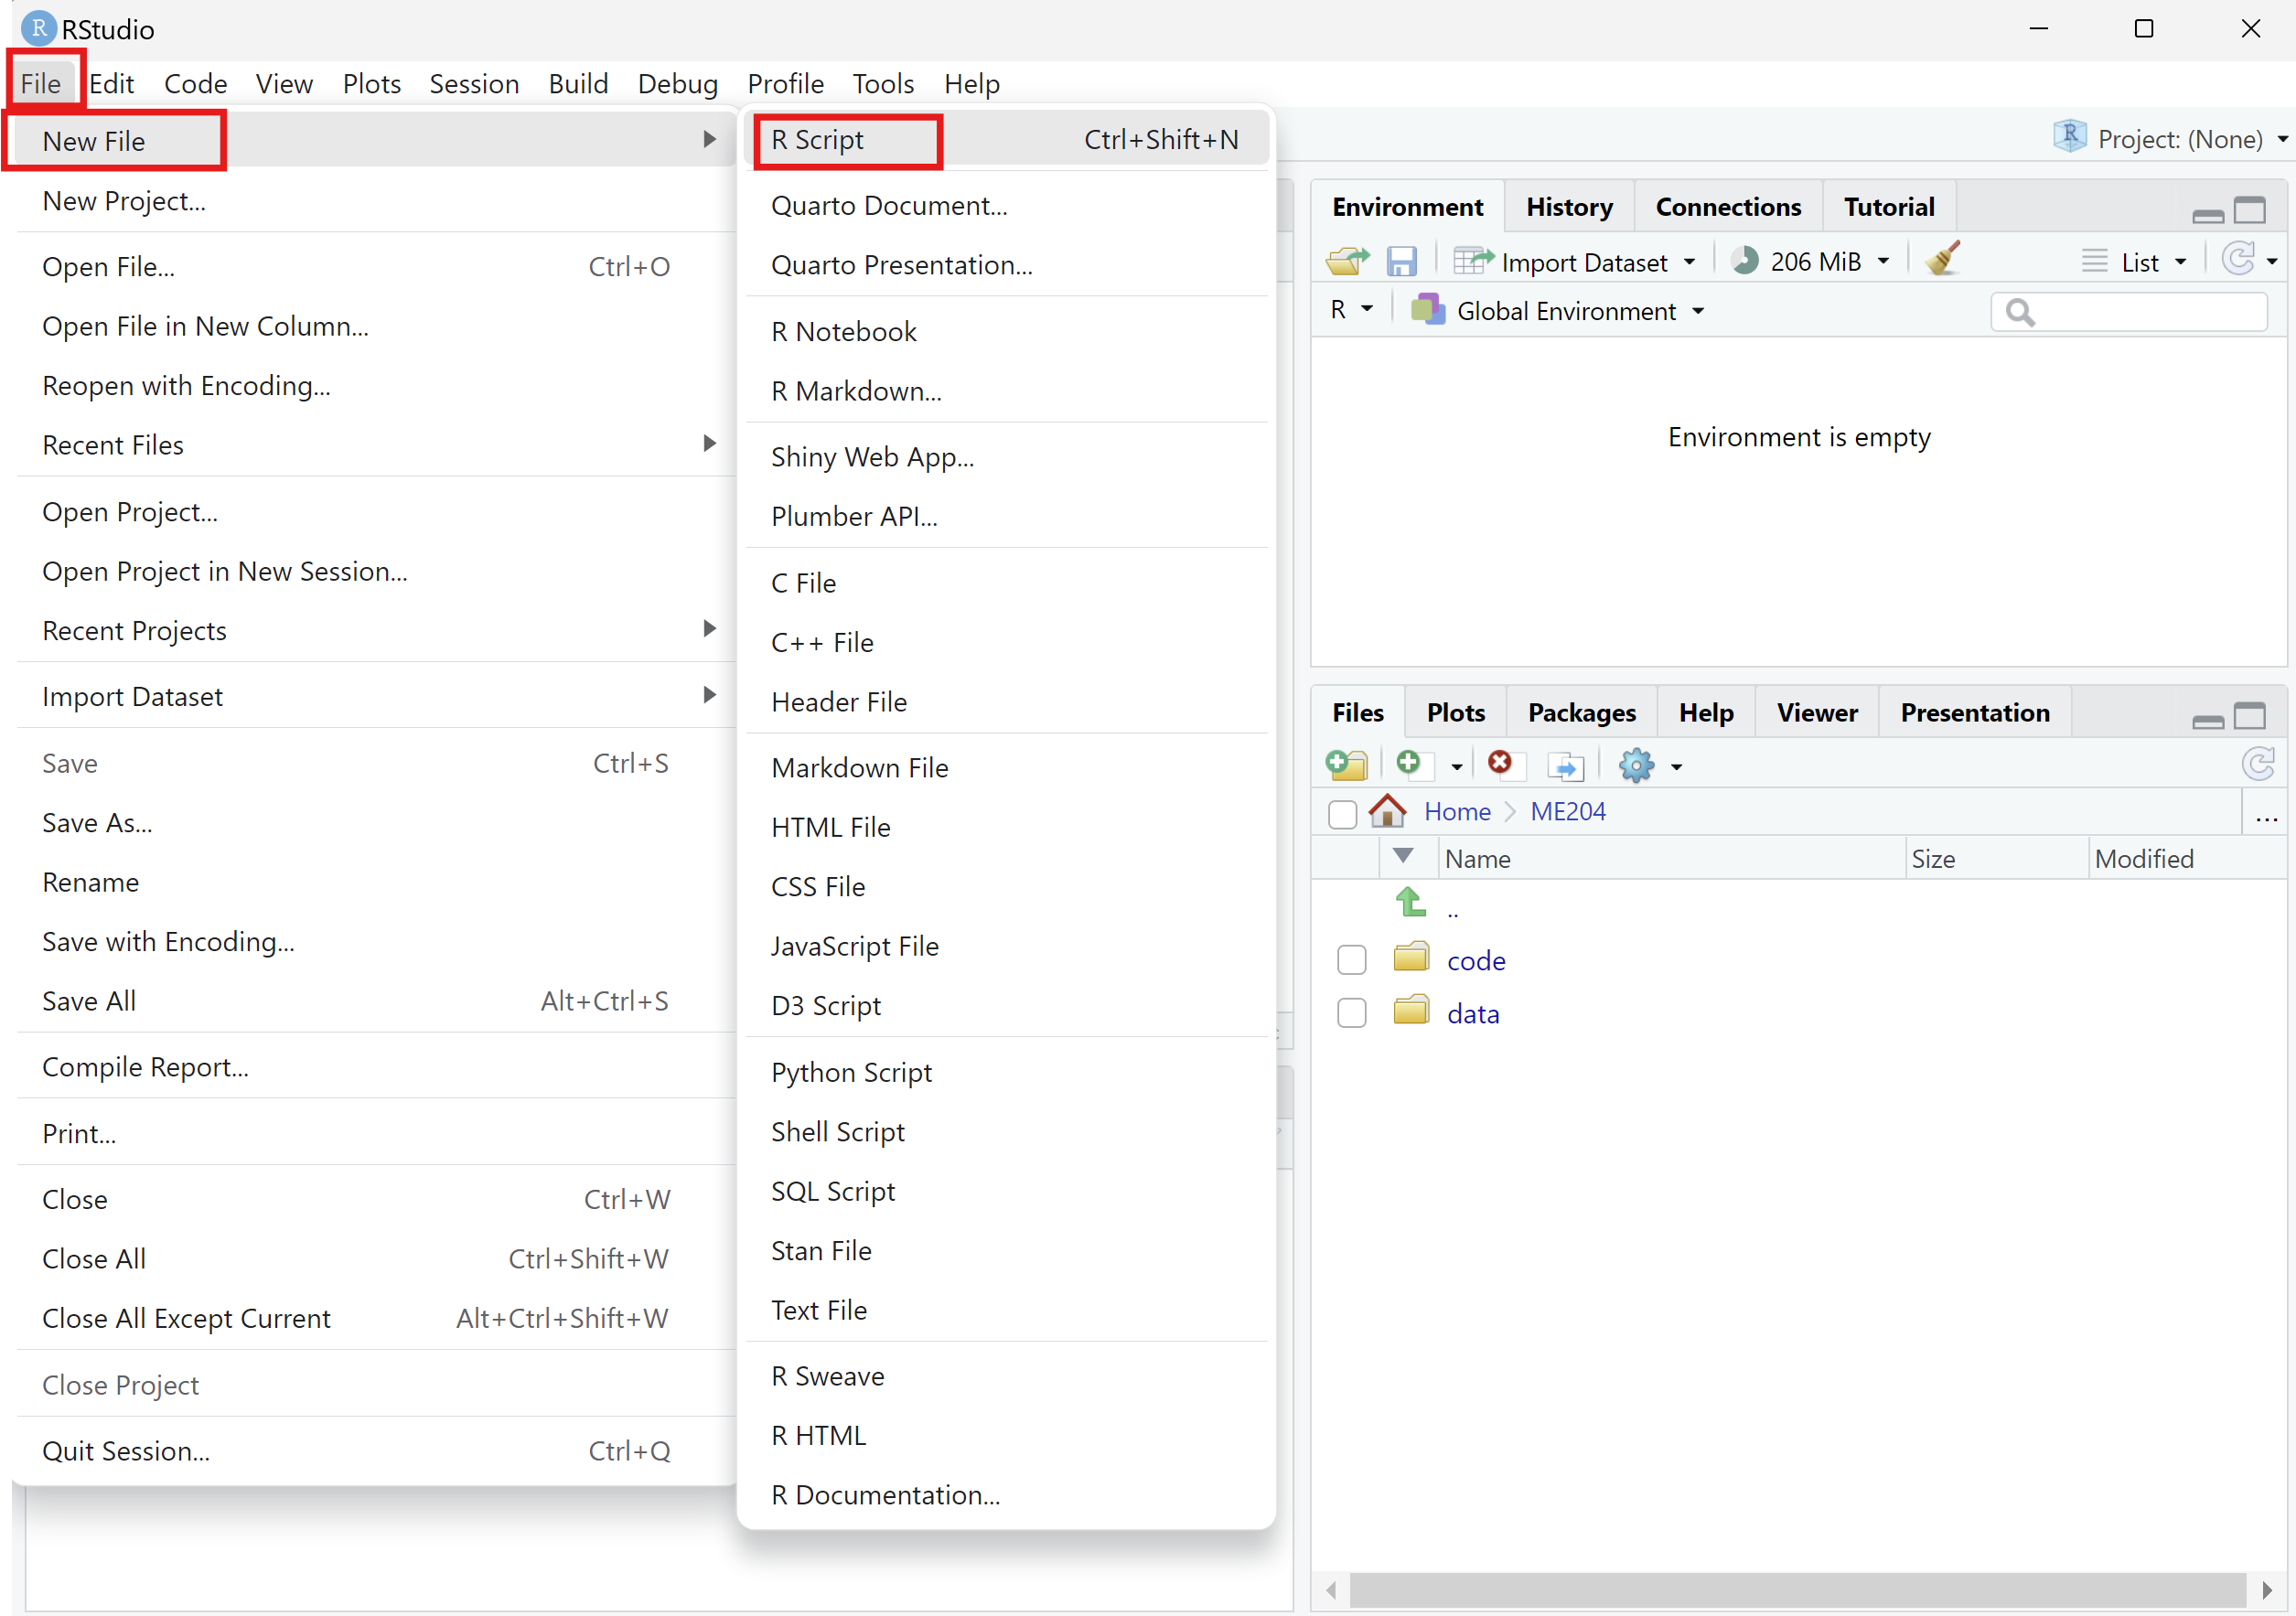
Add the following code snippet to the new file:
library(tidyverse)

df <- read_csv('./data/bakery.csv')

selected_columns <- c('data-product-id', 'data-product-name', 'data-product-on-offer', 'item-price')

print(df[selected_columns])
📝 NOTE: The
./represents the current folder (directory) from where the script is being run. This corresponds to your working directory.Save the file by clicking on
File>Saveoption or by pressingCtrl + Son your keyboard.VERY IMPORTANT: Save the file to the
ME204/codefolder with the following nameweek01-lab02.R. The image below shows the example for Windows, but the process is similar for Mac.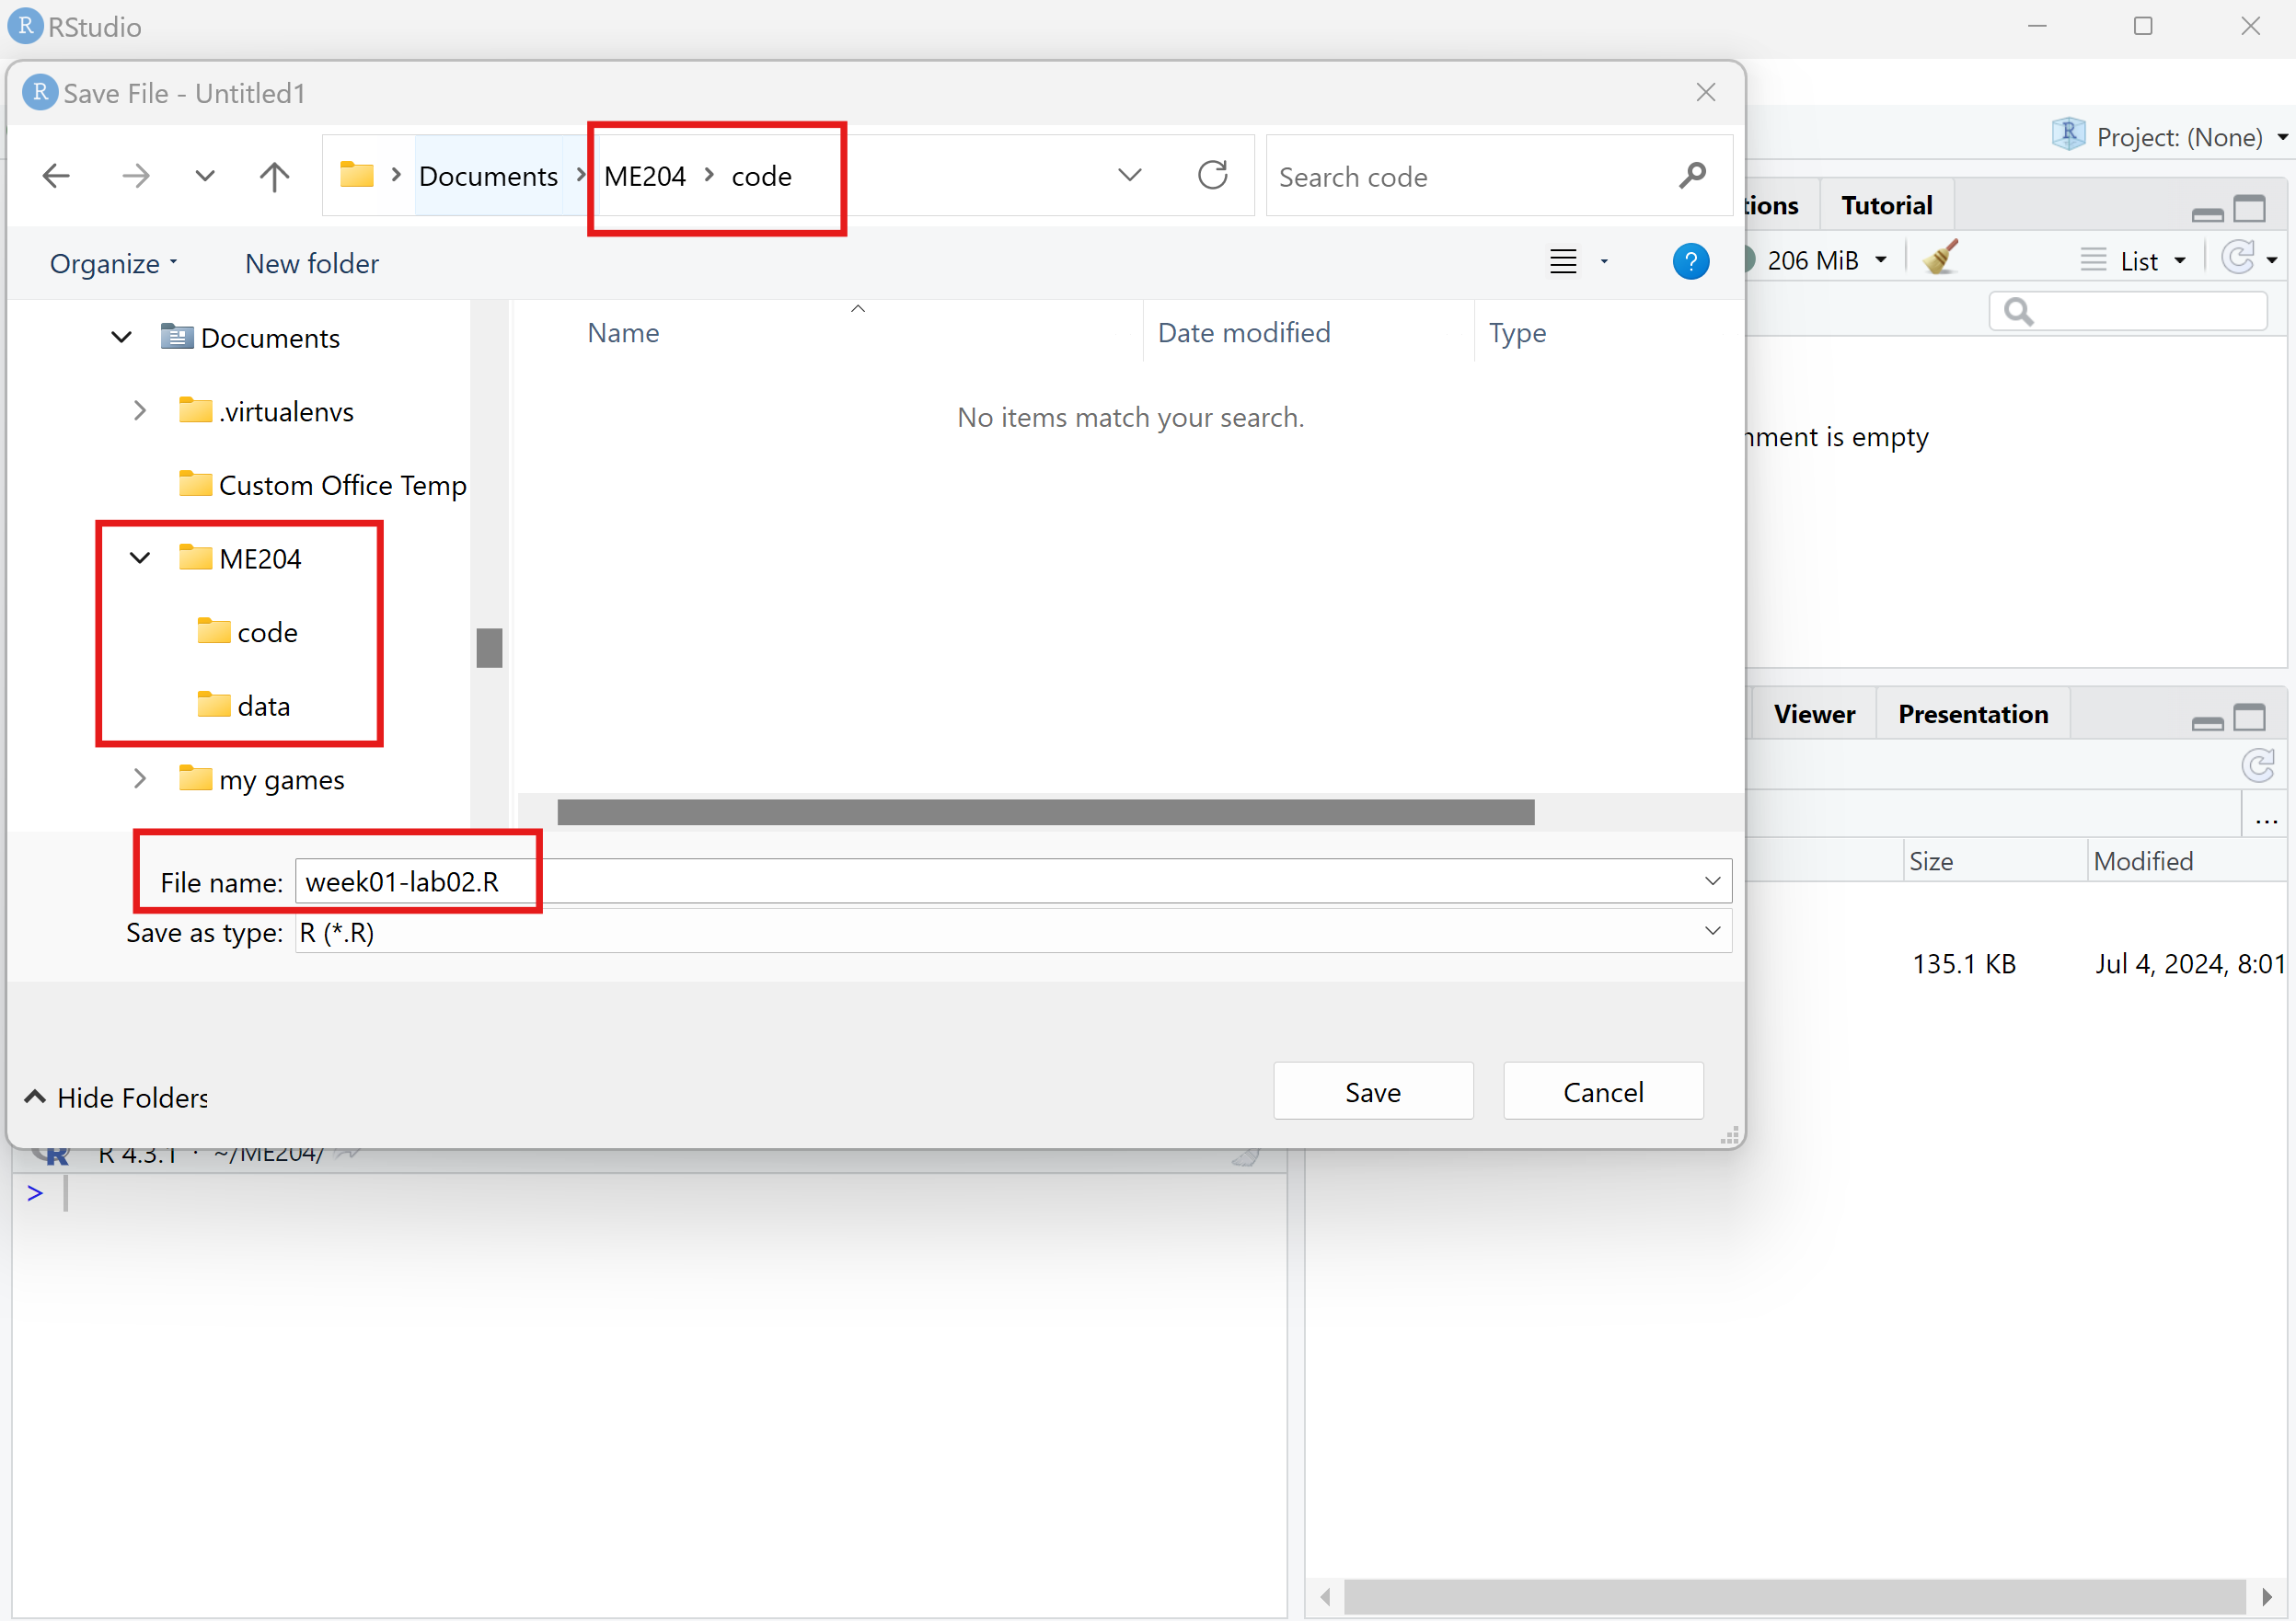
- 🧑🏫 TEACHING MOMENT: Your class teacher will demonstrate how to run your script and how to see the output of your code, and help you solve any issues you might have.
Part II: Changing Column Names and Dropping Duplicate Rows (35 min)
Add code to your existing script that adresses the following tasks.
📝 NOTE: Remember to always save the script before running it, either by pressing Ctrl + S or clicking on File > Save.
🎯 ACTION POINTS:
- Take a look at the columns
data-product-nameandproduct-name. Write code that establishes, without a doubt, whether these two columns are identical or not. If they are identical, drop one of the columns. If they are not, how would you modify the column names to make them consistent?
💡 TIPS
Check the Pandas documentation for the
equalsfunction in Python and the dplyr documentation for theidenticalfunction in R.You can use the
dropfunction in Python and theselectfunction in R to drop columns.
✅ Click to view the solution
In Python, you can use the equals function from the pandas library to compare two columns:
print(f"Are the columns identical? {df['product-name'].equals(df['data-product-name'])}")

if df['product-name'].equals(df['data-product-name']):
    print("The columns are identical. Dropping the 'data-product-name' column as it is redundant.")
    df = df.drop(columns=['data-product-name'])
else:
    print("The columns are not identical. Consider renaming the columns.")
In R, you can use the identical function to compare two columns:
if (identical(df$`product-name`, df$`data-product-name`)) {
  print("The columns are identical. Dropping the 'data-product-name' column as it is redundant.")
  df <- df %>% select(-`data-product-name`)
}else{
  print("The columns are not identical. Consider renaming the columns.")
}- Change the column names to more concise and meaningful names. For example,
data-product-idcan be renamed to the much simplerid,product-nametoname, and so on. Feel free to make your own choices, just be consistent.
💡 TIPS
In Python, you can use the rename function from the pandas library:
df = df.rename(columns={'old-column-name': 'new-column-name'})In R, you can use the rename function from the dplyr library (part of `tidyverse):
df <- df %>% rename(new_column_name = old_column_name)- What are the
ids that appear more than once in the data frame? Print out the values of theseids.
👉 HINT: You can use the duplicated function from the pandas library in Python and the duplicated function from the dplyr library in R.
✅ Click to view the solution
In Python, you can use the duplicated function from the pandas library:
duplicated_rows = df['id'].duplicated()
print(df[duplicated_rows]['id'].values) # It also works without the `values` part
In R, you can use the duplicated function from the dplyr library (part of `tidyverse):
duplicated_rows <- df %>% select(id) %>% duplicated()
print(df %>% filter(duplicated_rows) %>% select(id))- Challenge: Filter the data frame to show only the rows with the
ids identified above. Sort the data frame by theidcolumn and conclude whether the rows which share the sameidare identical or not.
👉 HINT: You can use the sort_values function from the pandas library in Python and the arrange function from the dplyr library in R.
- If the rows are indeed identical, drop the duplicates from the data frame. If they are not, how would you modify the
ids to make them consistent?
💡 TIPS
In Python, you can use the drop_duplicates function from the pandas library:
df = df.drop_duplicates(subset='id')In R, you can use the distinct function from the dplyr library (part of `tidyverse):
# .keep_all = TRUE ensures that all columns are kept
df <- df %>% distinct(id, .keep_all = TRUE)- Check the dimensions of the data frame again and compare them with the original dimensions. How many rows were dropped?
✅ Click to view the solution
In Python:
print(df.shape)In R:
print(dim(df))Part III: Cleaning Data Types (40 min)
- Print out the data types of all the columns in the data frame.
 Python
print(df.info())
 R
R
In tidyverse:
print(glimpse(df))Use what you have learned in the morning to modify the data types of the
idcolumn so it is represented as an integer.Remove all the
£symbols from thepricecolumn.
💡 TIPS
In Python, you can use the str.replace function to remove the £ symbol:
df['price'] = df['price'].str.replace('£', '')In R, you can use the str_replace function from the stringr package (contained in tidyverse) to remove the £ symbol:
df <- df %>% mutate(price = str_replace(price, '£', ''))- Challenge: Convert the
pricecolumn to a numeric data type. If there are any errors, figure out which rows are causing the issue and try to fix them.
The reason this is challenge is because you might need to use conditional statements to check for the presence of £ or something else in the price column.
💡 TIPS
In Python, you can use if-else statements inside an apply function to convert the column to numeric.
In R, you can use the case_when function from the dplyr library to convert the column to numeric.
🧑🏫 TEACHING MOMENT
When it gets closer to the end of the lab, your class teacher will show you how to solve the challenge task and discuss any issues you might have faced.
🎁 Bonus tasks
If you have completed all the tasks above, go back to the 🎁 Bonus Tasks of yesterday’s lab and see if you can solve them now. If you had already solved them, can you improve your code to use the new techniques you have learned today?