
📦 Final Project
⏲️ Due Date:
Monday, 29 July 2024 at 23:59:59, UK Time.
- But hopefully, you will be able to complete it by 26 July when the Summer School Session 2 ends.
This assignment is worth 75% of your final grade.
Have questions? Ask a question on the #help channel on Slack.
📝 The procedure
Click 🔗 HERE and click on the green button
Accept this assignment.You will be redirected to a new repository created for you. The repository will be named something like
LSE-ME204/me204-project-<your-username>, where<yourusername>is your GitHub username. The repository will be private and will contain the following initial structure: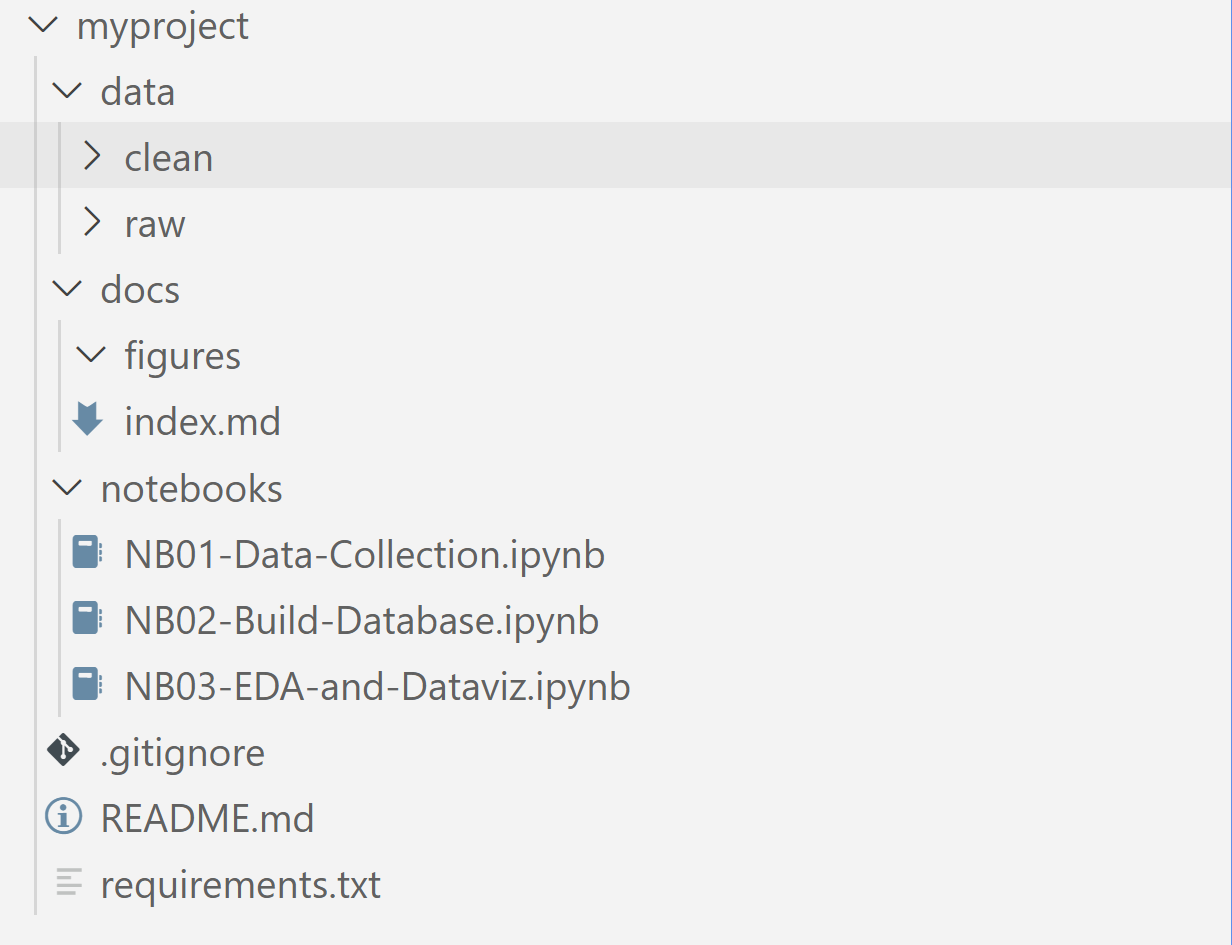
Most files will be completely empty, and it is part of the assignment to fill them in. Depending on the route you choose, you may need to create additional files or folders or replace the existing ones. You will find a description of each file in the sections below.
📝 NOTE: Whenever you modify the
README.md, the GitHub bot will add some text to it (to inform you of your deadline). This is normal and you don’t need to remove it.Using Git on your local machine, clone the repository to your computer and add it to your VSCode workspace.
Work on the code, start small and build complexity slowly.
Remember to
pull->commit->pushfrequently to avoid losing your work.Once you’re done with everything, check that all your code is reproducible and that you added enough information to the README file such that we can replicate your work.
- For example, if running your code requires creating credentials for an API, you should provide instructions on how to do that.
You don’t need to interact with Moodle for this assignment. Your submission will be graded based on the contents of the last state of your repository before the deadline (the last commit).
📋 Instructions
First, an important information: You are allowed to work in pairs in this project! You will still need to submit your work separately, but you can use the same data collection code and preprocessing code. **Your EDA and Storytelling should be unique to each of you, though.
Here’s your roadmap for this project:
Find a Data Source: Seek out a data source with ample volume to showcase your data manipulation skills. Choose either an API or perform web scraping from an open website (do not collect personal/sensitive data). If you are out of ideas, you can find some suggestions in the 💡 Ideas section below.
Write code to collect data: Collect the data using either webscraping or an API. Ensure you have the necessary permissions to collect the data.
Here you have alternative ways to write your code depending on what tools you are using:
requests: Add your code to thenotebooks/NB01-Data-Collection.ipynbfile if your code reliesscrapyCSS/XPath selectors,seleniumcode or API requests using therequestslibrary. Notebook got tooo big or too complex? Feel free to split it into multiple notebooks, say,NB01-Data-Collection-Data-Source-1.ipynb,NB01-Data-Collection-Data-Source-2.ipynb, etc.scrapy spiders: In this case, you won’t need theNB01-Data-Collection.ipynbfile. Instead, create acrawlerfolder and create your scrapy project there. Add instructions to theREADME.mdfile to explain how to run your spider.
Store raw data: Whatever data you capture above, store it in the
data/rawfolder of your repository. Use appropriate file formats (e.g.,.csv,.json,.xml, etc.).- To avoid the need for a constant Internet connection, you can store
.htmlfiles into thedata/rawfolder and use them as your data source. - Feel free to create subfolders in the
data/rawfolder if you have multiple data sources or to better organize your data.
- To avoid the need for a constant Internet connection, you can store
Preprocess and Tidy It Up: In the
notebooks/NB02-Data-Preprocessing.ipynbfile, add code to read the raw data, preprocess it, and store it as a.sqlitedatabase file.- All the data you will later use in your Exploratory Data Analysis must be stored in a single
.sqlitedatabase file you will create in this notebook. - Your database should have at least 2 tables.
- You must ensure that data types are appropriate and that the data is clean and tidy (e.g., no duplicates, no wasteful columns, etc.).
- All the data you will later use in your Exploratory Data Analysis must be stored in a single
Explore the Data: You should show that you posed “questions” to your data and that has led you to create plots or summary tables that tell us something about your data.
- Add your code to the
notebooks/NB03-Exploratory-Data-Analysis.ipynbfile if you are producing plots or tables using thelets-plotpackage (You must use thelets-plotpackage to create these plots if doing that from a notebook. ) - If you are creating a Streamlit dashboard, create a
dashboardfolder and add your code there. Add instructions to theREADME.mdfile to explain how to run your dashboard. - There’s no minimum or maximum number of plots or tables you should create. You should create as many as you need to tell something interesting about your data.
- Add your code to the
Craft a story: Once you have created your plots and tables, create a brief report in the
docs/index.qmdfile summarising your thought process and the insights you have gained from your data.This truly does not need to be long. Here are a few suggestions of headers you could use:
- About me: Who are you and why did you create this project (“I am a Econ student from XXXX and I created this project as part of the LSE Summer School ME204 course (2024)” should suffice, for example)
- The Data: What data source did you choose? Why did you choose it? How did you collect it? What was challenging about it?
- Key Findings: What are the main insights you gained from your data? What are the most interesting things you found? Something like “Once I cleaned up the data by doing X, Y and Z, I found that the price of bread in the UK has increased by 20% in the last 5 years while the price of milk has remained stable, as shown in the plot below” would be a good example.
- Future: What would you do next if you had more time? What other questions could you ask of this data? What other data sources could you use to complement this data?
Wrap Up: After ensuring that your notebooks are neat and well-commented, and that everything is running smoothly, edit the
README.mdfile to include:- Clear instructions on how to recreate your development environment (conda environment, packages, etc.).
- When you deviated from the original instructions, explain why you did so and where we should go next to run your code.
- Add a GenAI Acknowledgement section at the end of the
README.mdfile. Describe if and how you used any GenAI platforms to help you with this project.
Commit and Push: Upload all your changes to GitHub before the deadline.
- We have set up GitHub such that you will not be able to push any changes after the deadline!
Good luck, and have a blast working on your project!
💡 Ideas
Here are some ideas you can explore if you’re unsure where to start:
Consider reusing some of the data sources we have used in class. For example, you could write the code to scrape information about products from the Waitrose website – check the robots.txt file to ensure you’re not violating any terms of service.
You could also use the Open Food Facts API to explore food products and their nutritional information.
- Remember that simply downloading the static data from the website does not meet the requirements of this project. You should use the API to collect the data.
Still on the food/supermarket theme, you could scrape data from other UK supermarket chains like Tesco, Sainsbury’s, or Asda and compare the prices of similar products across different stores.
Consider using data from the Wikimedia projects — it offers a treasure trove of data from various sources (Wikipedia, Wikidata, Wiktionary, etc.). Pick a theme, like “hurricane records over history,” and begin your exploration.
I would be curious to see a project that works on the list provided by Instances.Social. This website contains a list of all Mastodon instances, social media platforms that act as alternative to the Big Tech platforms, are locally moderated and have their own rules. It would be fun to see a visualisation that compares the number of users in each instance, etc., and interestingly, what are the rules that each instance puts publicly on their main website.
- Please avoid scraping individual posts from these instances, unless explicitly allowed by the instance’s rules.
✔️ How we will assess your submission:
- Scoring: This assignment has a maximum score of 100 points. The points for each task are specified next to the task names.
- Weightage: This assessment contributes to 75% of your final grade.
- Assessment Criteria:
- Correctness: We will evaluate if you followed the instructions precisely.
- Creativity: We’ll assess the ingenuity and originality of your ideas for data sources, data manipulation, and data visualisation.
- Organization, Style, and Efficiency: We will evaluate your code and markdown on clarity, organisation, high-quality comments, and adherence to the best use of the particular coding philosophy taught in the course.
- Weighting: Initially, we plan to use the following weighting: 30% for correctness, 15% for creativity, and 55% for organisation, style, and efficiency. If this weighting leads to too many high scores, we might need to apply small changes to these weights based on the submissions received to match the Marking Scheme Expectations below.
- Expected Score: A pristine job would likely score around 70%. This means flawless code, high efficiency, and impeccable markdown formatting with well-documented comments that make it a delightful read. Scoring beyond that indicates exceptional performance, showcasing genius-level work (or potential leniency in our assessment).
Remember, the main goal is for you to learn and grow throughout this process. So, give it your best shot, and we look forward to seeing your remarkable work!
More on ‘Organisation, Style, and Efficiency’
To achieve a good score in this which is the most valuable criterion, it’s imperative that you showcase your data wrangling skills. We will be looking for the following:
- Good use of pandas functions to clean and preprocess the data. We see no traditional
forloops other than the necessary list comprehensions. - Skillful application and use of custom functions, especially when dealing with long or repetitive code sections.
- Effective use of
ggplotwith appropriate choice of geoms, aesthetics, and scales to create meaningful visualizations. - Well-organized and clean code, along with a structured file organization.
- Good use of markdown formatting to create a clear and concise report.
- Appropriate usage of data types, going the extra mile to make your tidy data concise and well-organized.
- A coherent data storytelling approach that effectively communicates the insights from your data analysis.
- Skillful data summarization using group-by operations and aggregations.
- Proficiency in data reshaping, demonstrated through the use of pivotting,
pd.explode()and other relevant functions.
Remember, your data wrangling skills will be a significant determinant of your success in this assignment. So, focus on showcasing your mastery of these techniques to create a compelling and insightful project. Good luck!
Marking scheme expectations
| Percentage Mark | Letter Grade Equivalent |
|---|---|
| 80+ | A+ |
| 70-79 | A |
| 65-69 | A- |
| 60-64 | B+ |
| 50-59 | B |
| 48-49 | B- |
| 42-47 | C+ |
| 40-41 | C |
| 39 or less | F |
You should expect to earn around B+ or A- points (good and excellent scores!) if you have followed all instructions correctly, although you might have made some inefficient choices in your code or your files need better formatting. For instance, if you did not create custom R functions when it could have made your code more efficient, you didn’t use suitable data types, the structure of files and directories is sub-par, or the layout and aesthetics of your markdown file were not particularly clear and easy to follow.
You should expect closer to an A if, on top of following all instructions to the letter, your code looks really neat and organised, to a point where we felt impressed. The HTML produced by your docs/index.md file is well-structured, easy to read, and visually appealing.
You should expect more >70/100 (the upper band of A and beyond) only if, on top of being correct and well-formatted and efficient, your submission contained some really elegant use and concise use of pandas functions, ggplot functions, and markdown formatting.
You should expect less than 55/100 if you did not follow the instructions, did not produce the suitable output files, or did not use any functions or any of the pandas functions we have been exploring in class.