
💻 Lab 01 – Meet the Data Frame
Lab roadmap (90 min)
🗒️ The Brief
Today, we will learn how to load, manipulate, and visualize tabular data 1 and compare the R vs. Python ways of doing so.
🥅 Learning Objectives
- Practice setting up your IDE for a productive workflow.
- View CSV data in its plain text form.
- Load and view tabular CSV data as a data frame in R and Python.
- Select and filter the data frame in R and Python.
- Rank the data frame by column values in R and Python.
📋 Lab Tasks
Let’s get started!
Part I: Introductions & Set up (20 min)
🧑🏻🏫 TEACHING MOMENT: Your chance to get to know your instructor and classmates.
💡 TIP: Whenever you see a 🧑🏻🏫 TEACHING MOMENT in the lab roadmap, it means your instructor will be talking to you, and they deserve your full attention. Please do not work on the lab exercises during these moments. You will have plenty of time to do so later on.
Meet your class teacher! Say hello and introduce yourself.
👥 Pair up! Ideally, you should work in pairs during this lab. If you were an R person in the morning, pair up with a Python person now, and vice versa. If you are in an odd-numbered group, you can work in a group of three.
- Groups of 4 are also fine. Just make sure you are mixing R and Python people.
🎯 ACTION POINTS:
Time for some action:
Follow the instructions on the Section 4 of the 📋 Getting Ready page.
📝 NOTE: If you couldn’t install everything on your laptop in the morning, use the PC provided in the classroom. The computers already have all the Python/R tools you need.
Contact your class teacher if you have any issues.
Part II: View the data (20 min)
We will give you some data to demonstrate how to load and view it in R and Python.
Try to figure out what the data is about and where it comes from! 🔮
🎯 ACTION POINTS:
Download the data file below.
👉 We will learn more about CSV files and other file formats tomorrow.
IMPORTANT: Save it to the
ME204/datafolder on your computer.(Optional) If you are familiar with Microsoft Excel, open the file to see what it looks like. 👉 If prompted by Excel if you want to modify the file, choose 'No'!
View the data in its raw form.
 (VS Code)
On the left sidebar, click on the
Explorericon and navigate to theME204/datafolder.Click on the
bakery.csvfile.You should see the contents of the file in the editor.
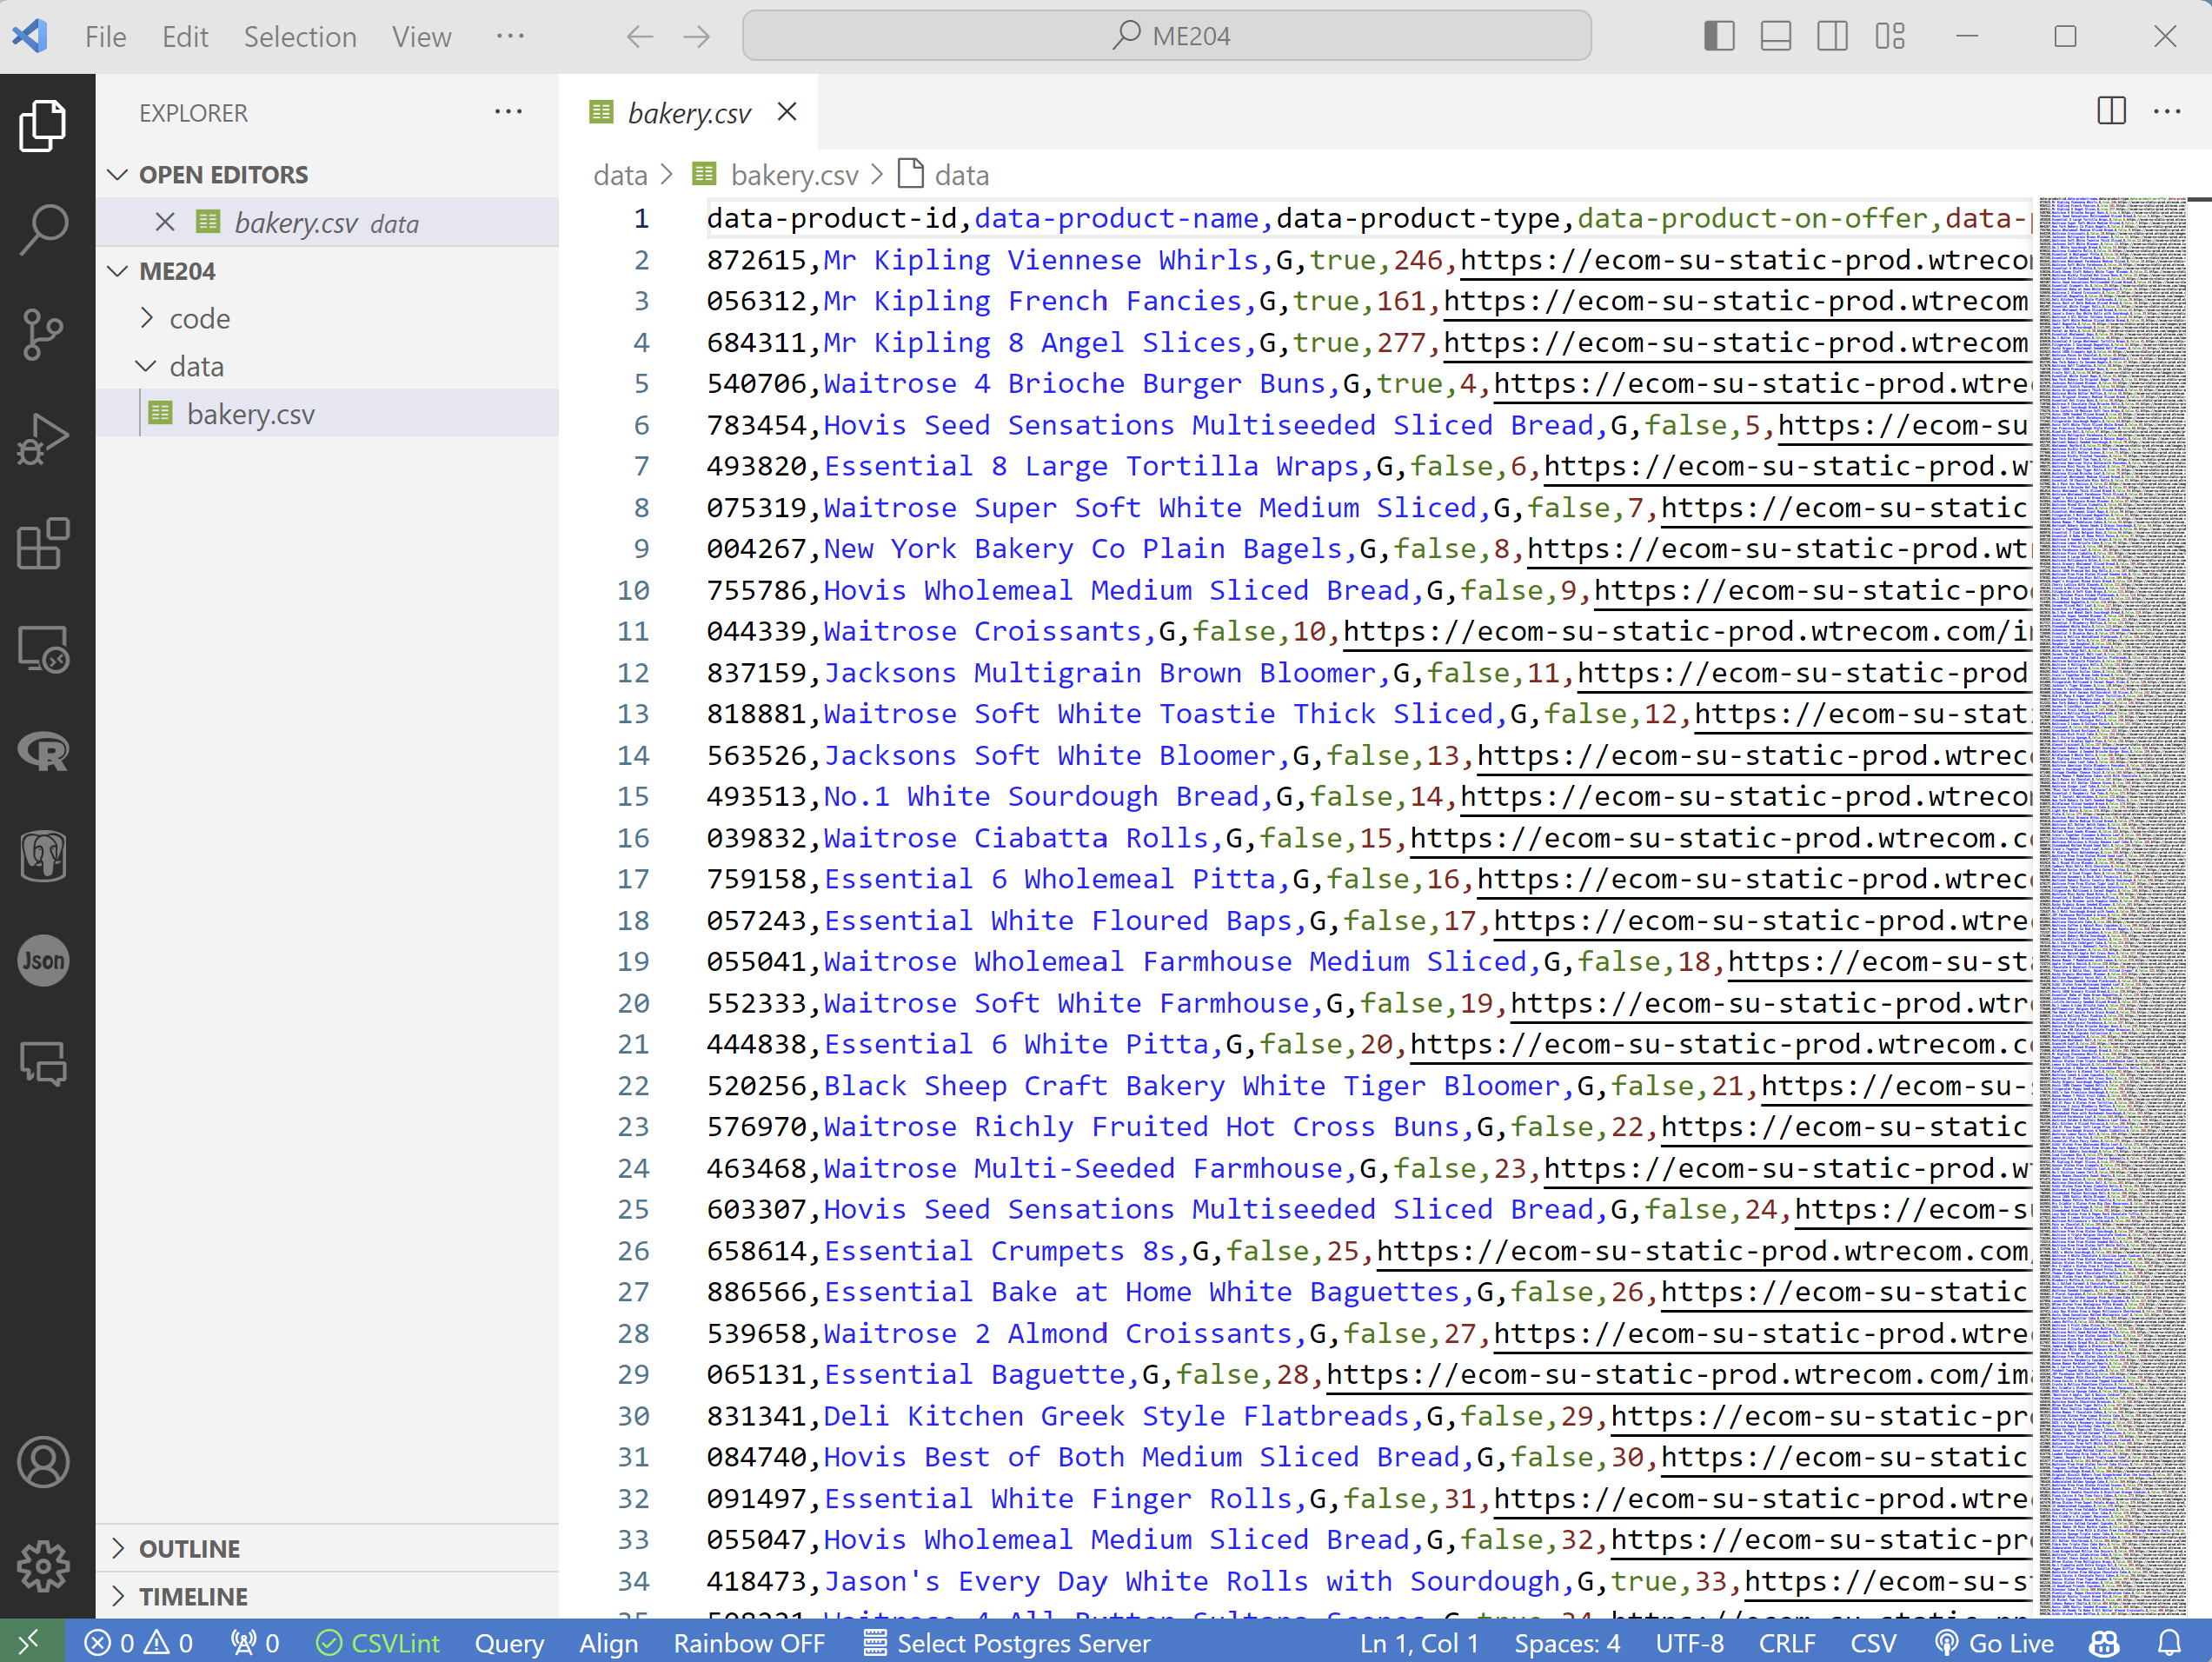
💡 TIP: Install the Rainbow CSV extension to make it easier to read CSV files.
 (RStudio)
On the right sidebar, click on the
Filestab and navigate to theME204/datafolder.Click on the
bakery.csvfile and select theView Fileoption.
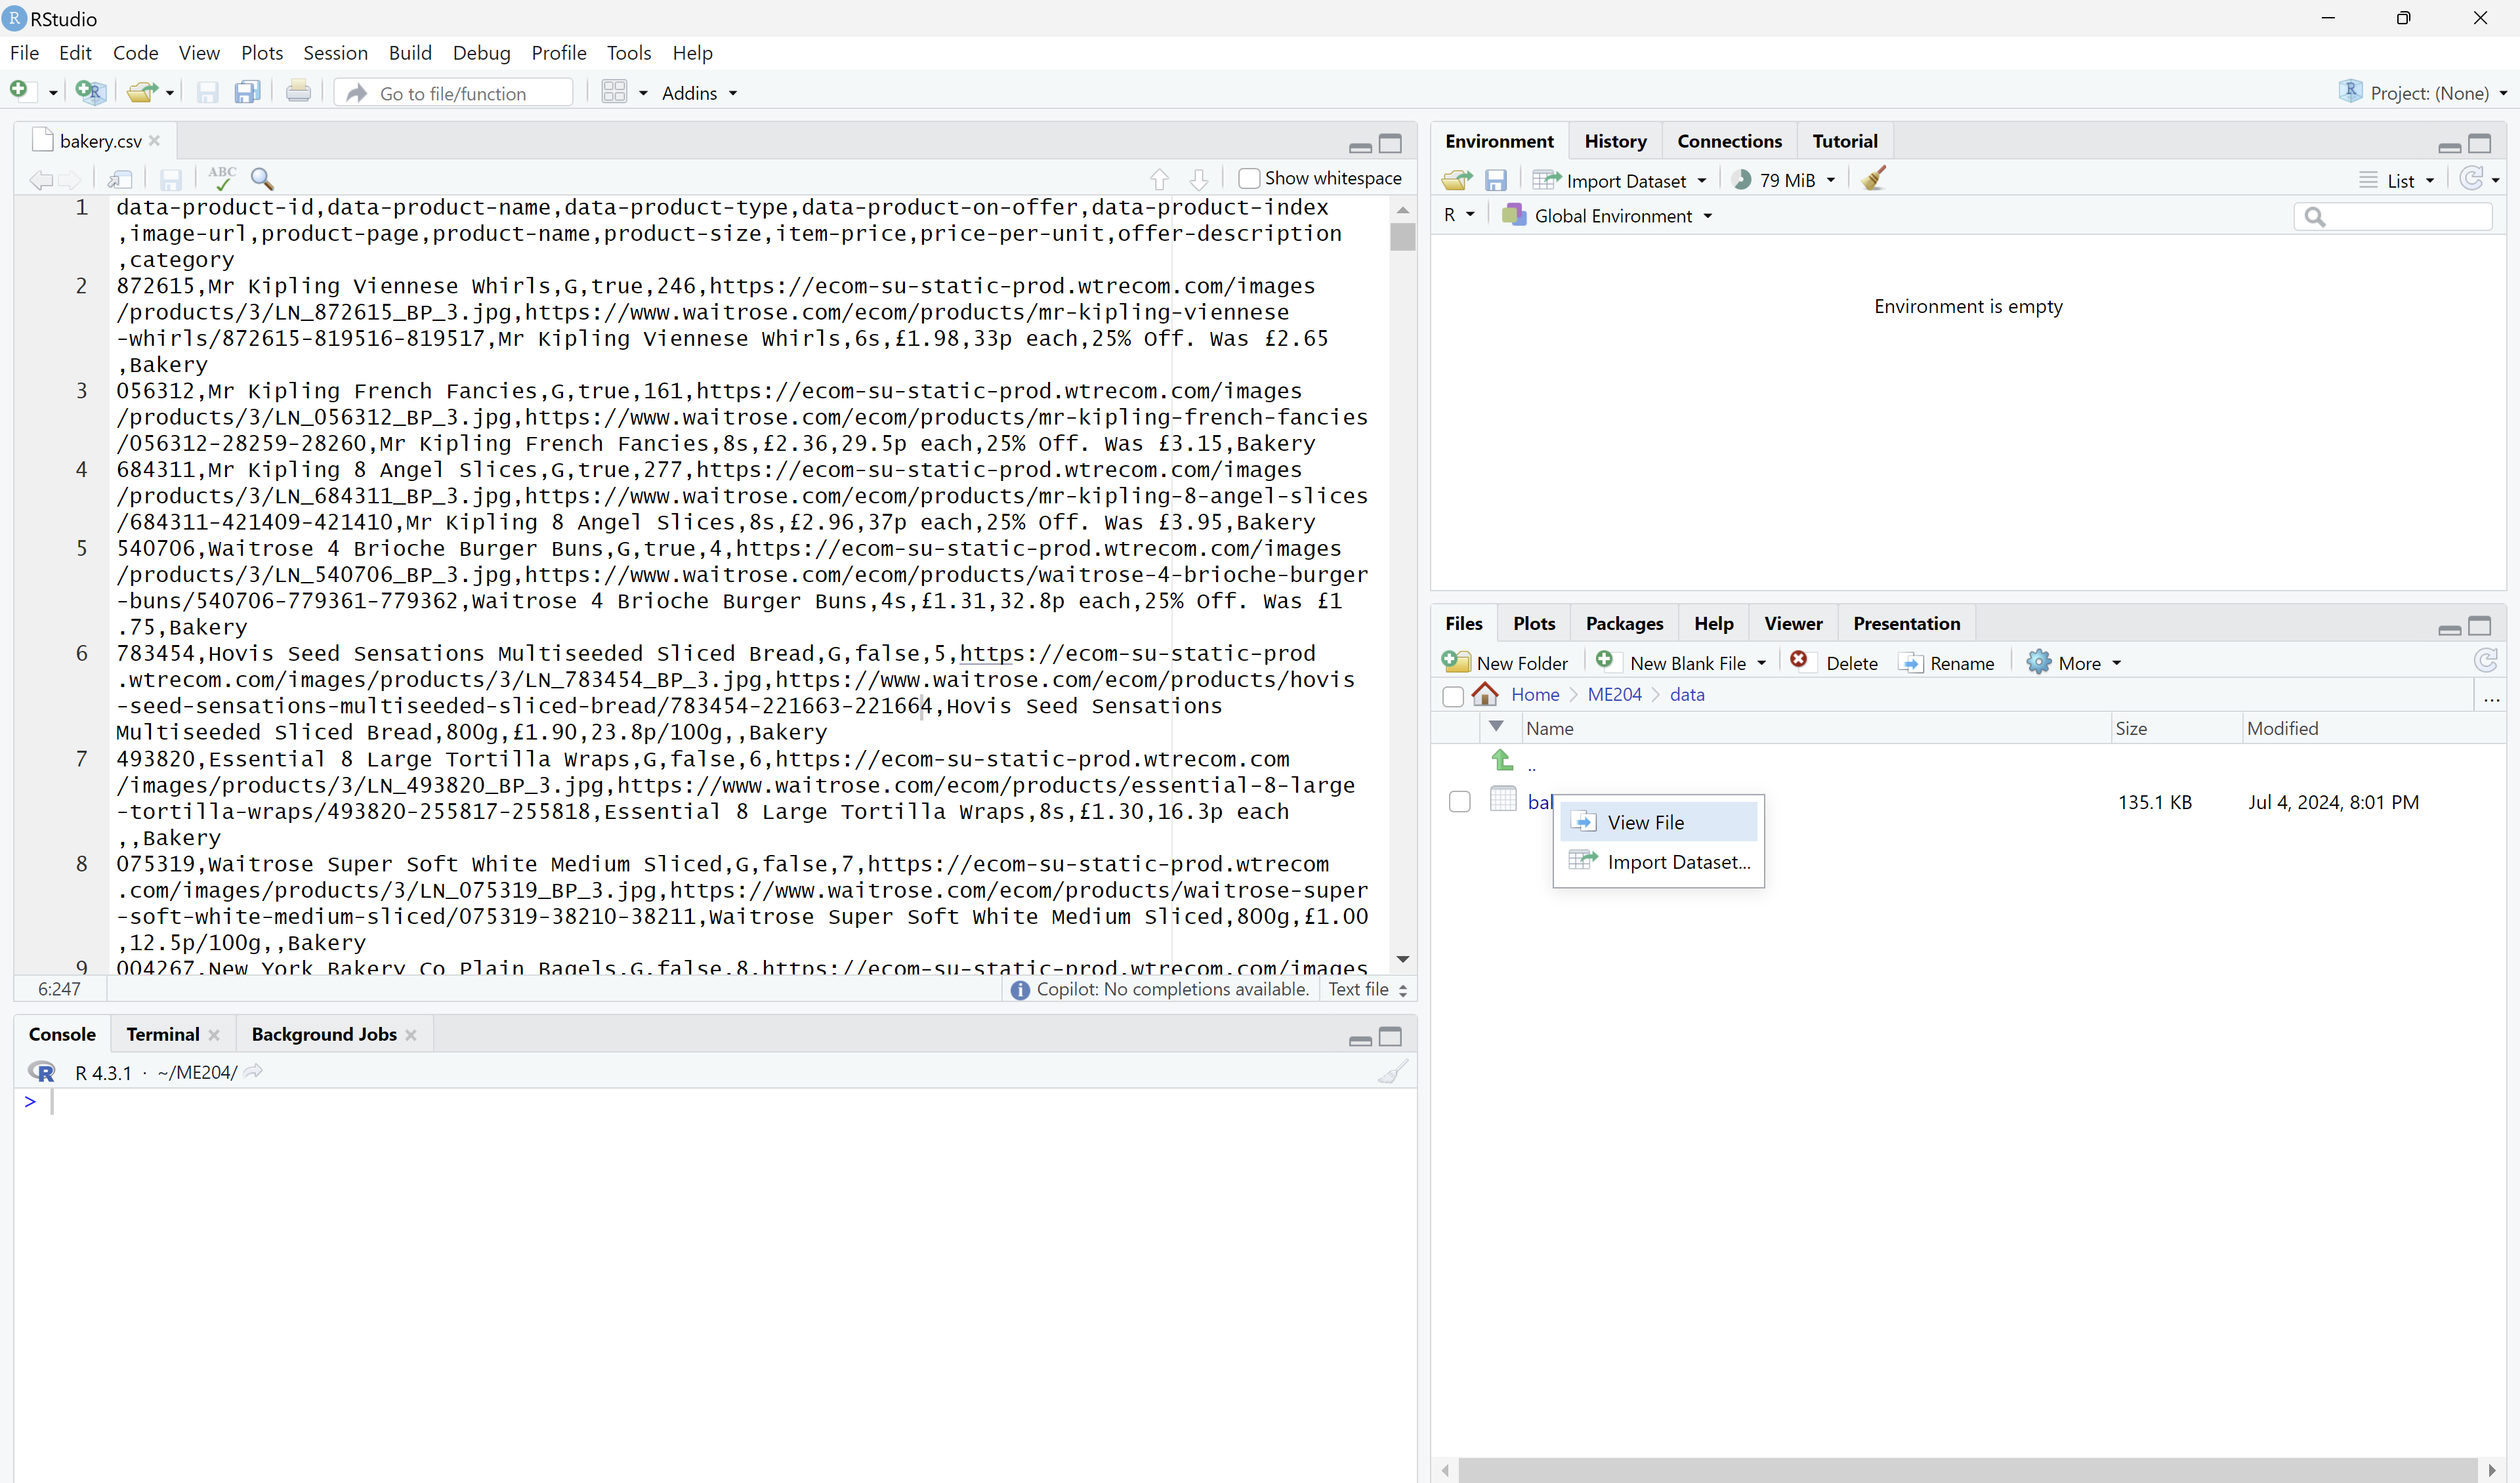
Discuss with your partner what you see in the data file.
Load the data into a data frame 2 in R and Python.
 Python
Open the Terminal on VS Code (
Terminal>New Terminal).Type
ipython(orpythonif that does not work) and pressEnterto open the Python interpreter.Type the following code to load the data as a data frame:
import pandas as pd
df = pd.read_csv('data/bakery.csv')
Type
dfand pressEnterto view the data frame.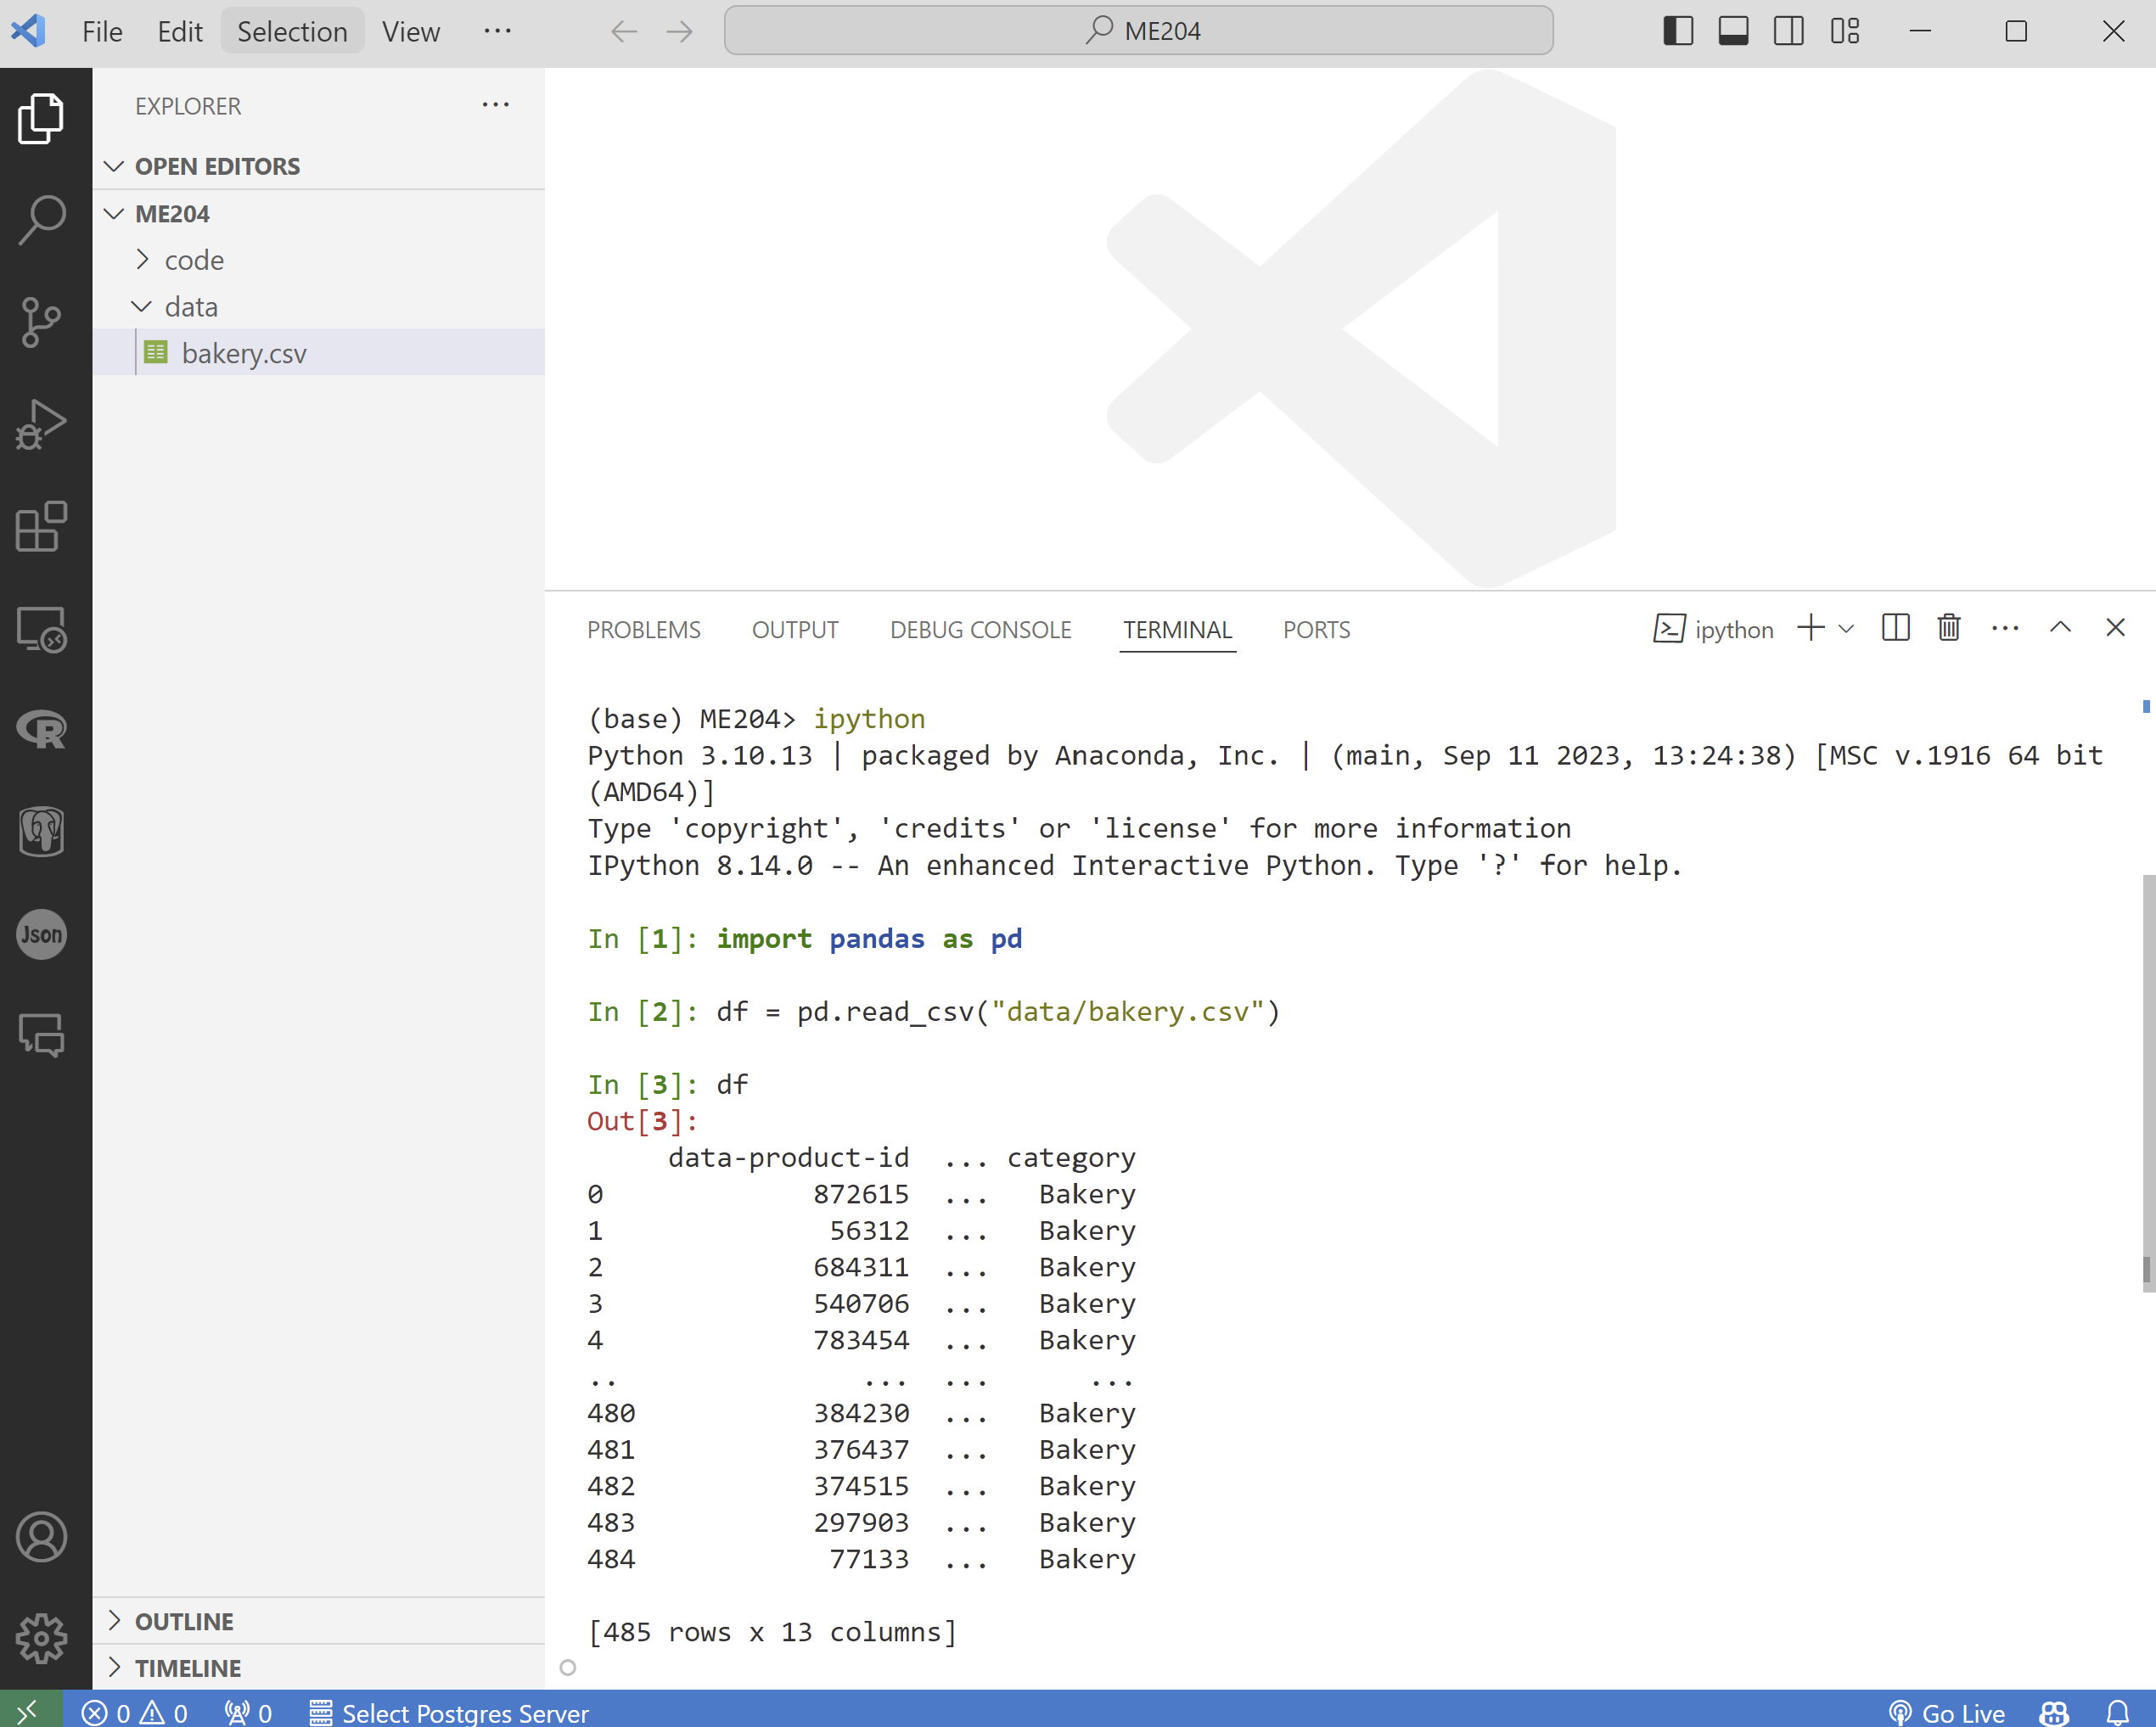
 R
ROpen the R Console in RStudio.
Type the following code to load the data as a data frame:
library(tidyverse)
df <- read_csv('data/bakery.csv')
Type
dfand pressEnterto view the data frame.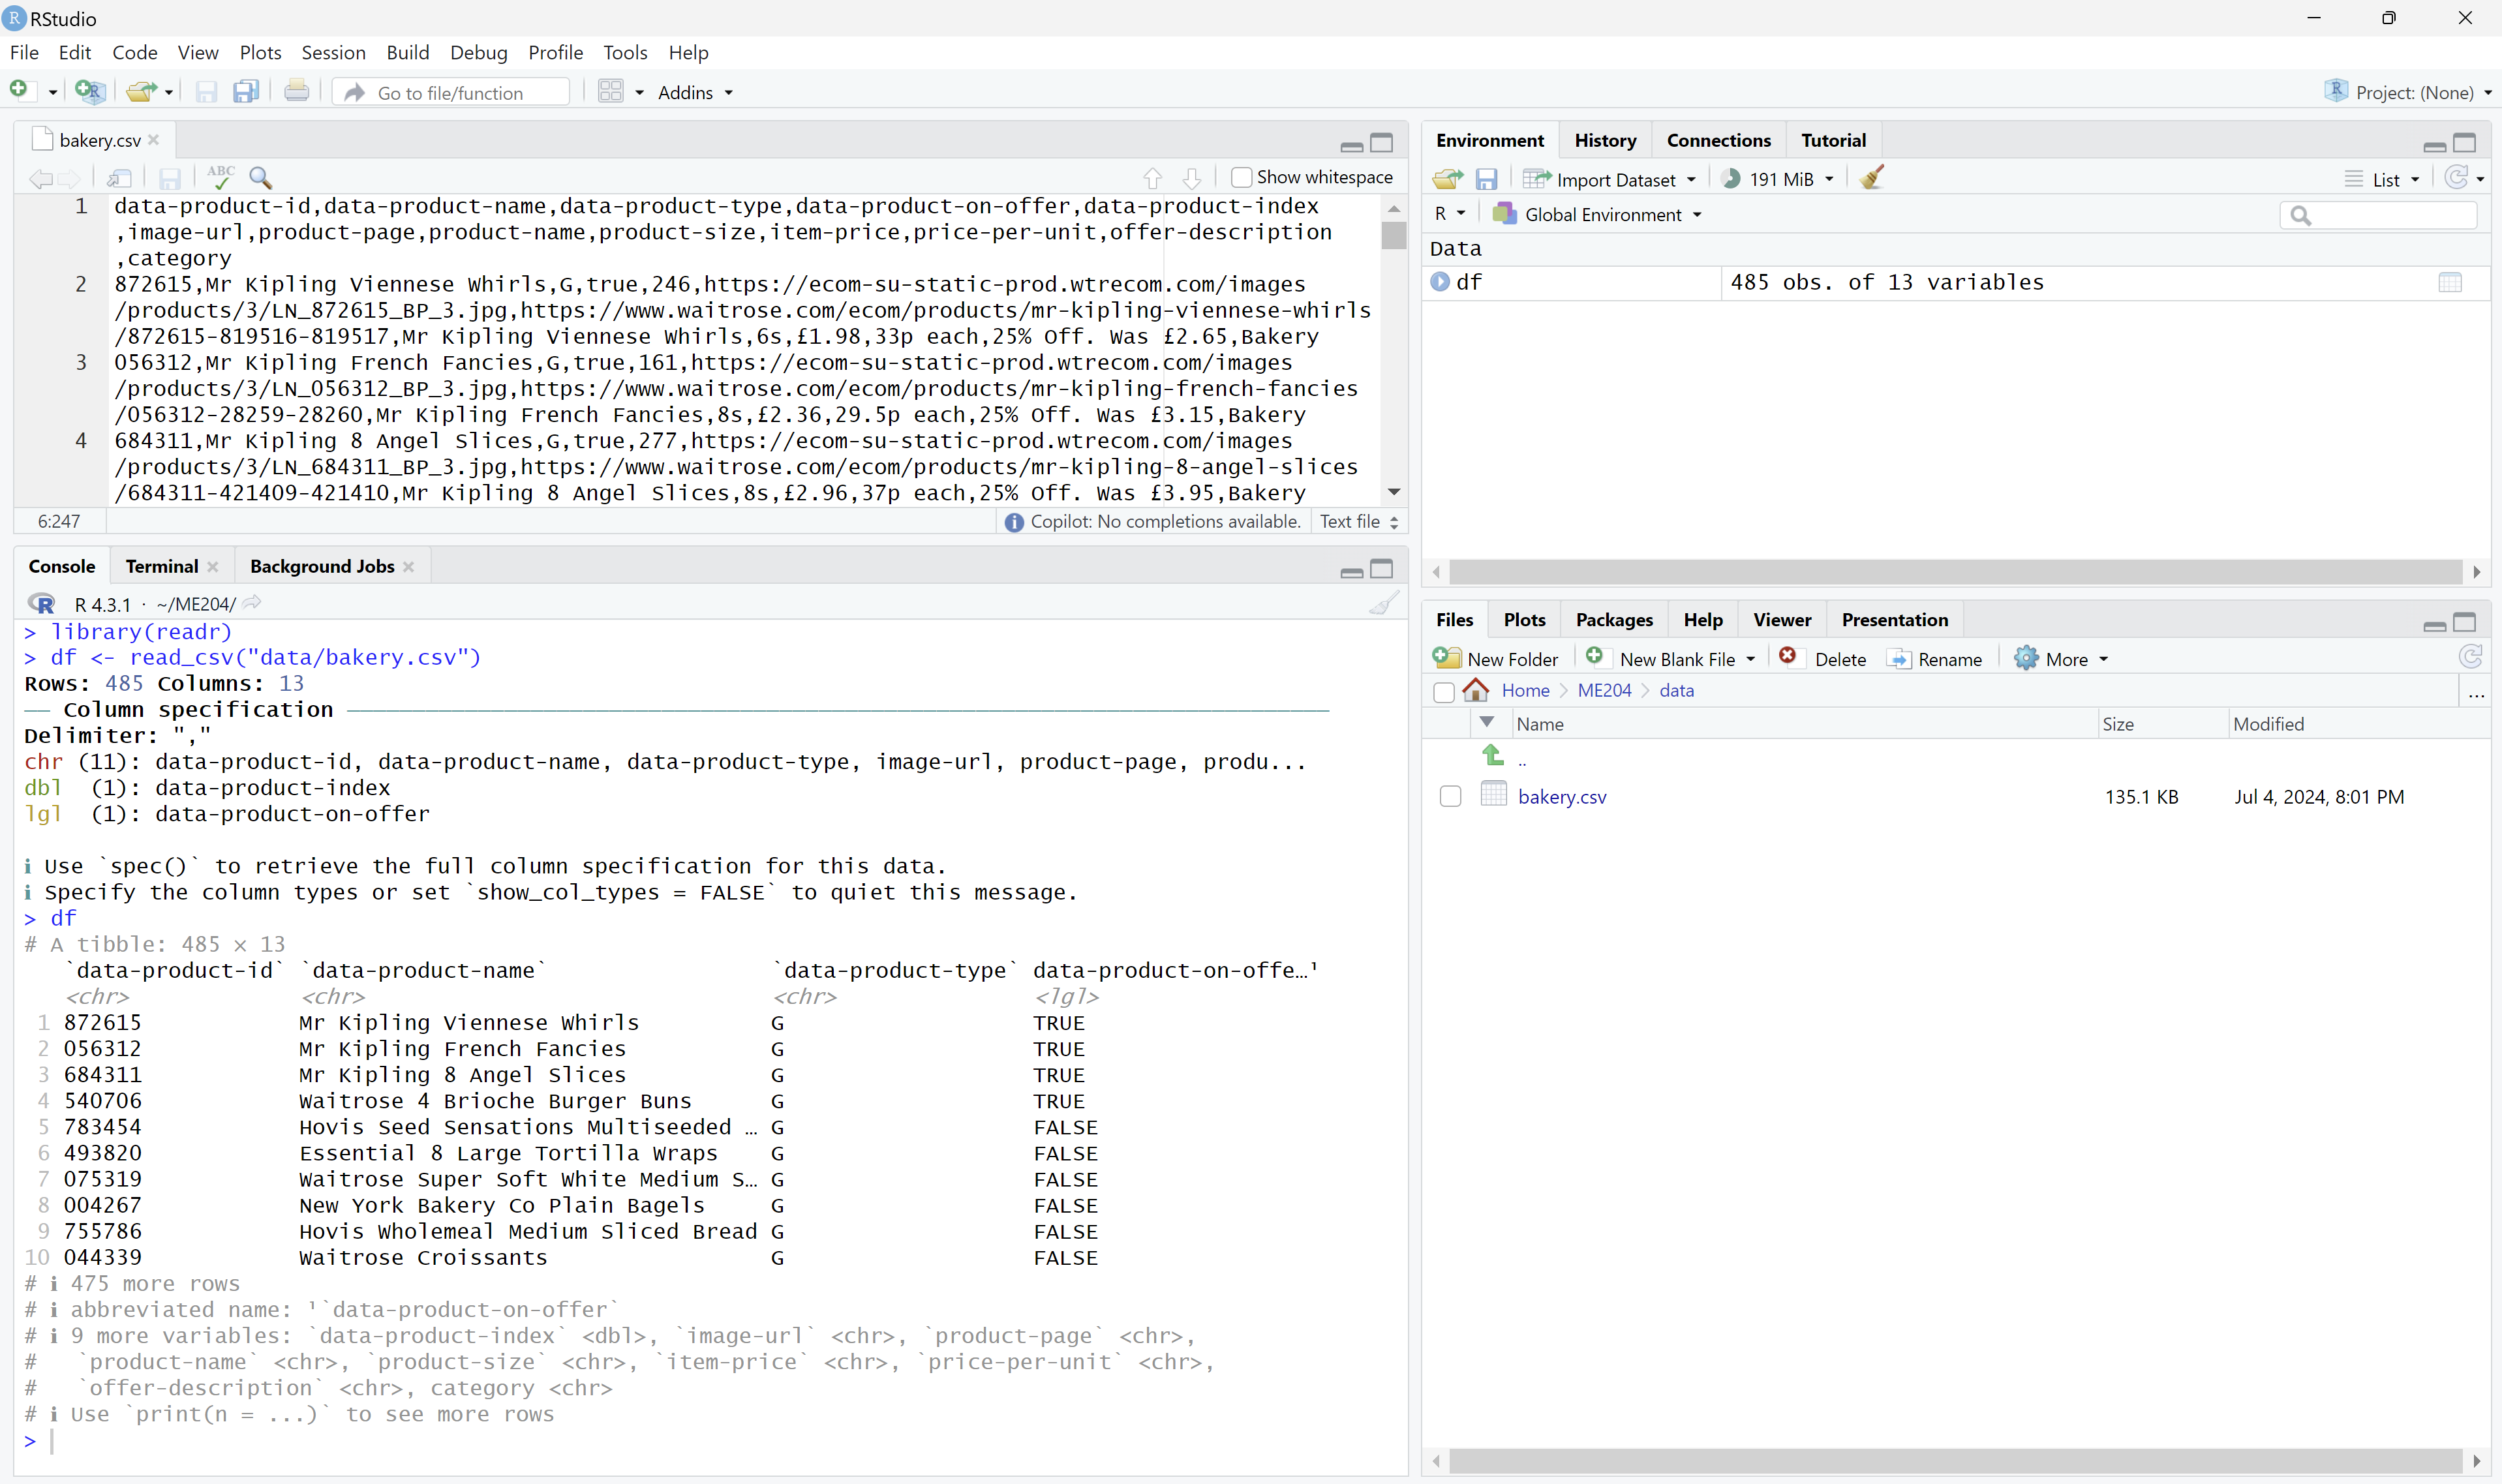
Discuss with your partner how the data is displayed differently in R and Python and respective IDEs.
🧑🏻🏫 TEACHING MOMENT:
Your class teacher will answer any questions you have about the data and the code you just ran and mediate the following 🗣️ CLASSROOM DISCUSSION:
- The data is the same but the level of information displayed is different from VS Code (Python) and RStudio (R). Do you see the differences?
Part III: Select and filter the data (40 min)
Now that you have loaded the data, let’s practice selecting and filtering the data frame. As you go through the exercises, try to stop every now and then to discuss with your partner how the code and results differ between R and Python.
🎯 ACTION POINTS:
Inspect: how many rows and columns are in the data frame?
PythonIn Pandas, the
shapeattribute gives you the dimensions of the data frame:df.shape RIn R, you can use the
dimfunction:dim(df)List all the columns present in the data frame.
Pythondf.columns Rcolnames(df)The precise format will depend on the language you are using, but you should see a list like this:
[
    'data-product-id', 'data-product-name', 'data-product-type',
    'data-product-on-offer', 'data-product-index', 'image-url',
    'product-page', 'product-name', 'product-size', 'item-price',
    'price-per-unit', 'offer-description', 'category'
]
The above should now give you a better idea of what the data is about.
Select just a subset of columns to view.
PythonUsing Pandas:
df[['product-name', 'item-price', 'category']] RWith the
tidyverse:df %>% select(`product-name`, `item-price`, `category`)We are not using base R in this course, but if we were, we would pass the column names like this:
df[, c(`product-name`, `item-price`, `category`)]The
c( )function is R’s way of creating a vector of column names.Select the first 5 rows of the data frame.
PythonUse the pandas
headmethod:df.head(5)You can compound this with the previous step to select columns at the same time:
df[['product-name', 'item-price', 'category']].head(5)Or
df.head(5)[['product-name', 'item-price', 'category']] RUsing the
tidyverse:df %>% slice_head(n = 5)You can compound this with the previous step to select columns at the same time:
df %>% select(`product-name`, `item-price`, `category`) %>% slice_head(n = 5)Or
df %>% slice_head(n = 5) %>% select(`product-name`, `item-price`, `category`)View the full record of the first row:
PythonThe
ilocmethod, which stands for “integer location,” can be used to select rows by their position in the data frame. Python uses 0-based indexing, so the first row is at position 0:df.iloc[0] RThe
slicefunction can be used to select rows by their position in the data frame. R uses 1-based indexing, so the first row is at position 1:df %>% slice(1)Filter the data frame to just the rows where the product has a particular size:
👉 Here the code starts to get a bit more complex, as filtering typically involves multiple steps. In a single line of code we typically: identify a column to filter, check the content of all items in that column to establish if it contains a desired value, and then return only the rows that meet the criteria.
PythonThere are multiple ways to filter data in pandas.
OPTION A: One way is to use the
querymethod:df.query('`product-size` == "800g"')To get a better view of the data, you can filter and select columns at the same time:
df.query('`product-size` == "800g"')[['product-name', 'item-price', 'category']]OPTION B: Another way to filter is to first get a list of True/False values for each row based on the condition, and then use that list to filter the data frame:
# Run this line to see the list of True/False values
df['product-size'] == '800g'
Now, to use this list to filter the data frame, pass it inside the square brackets:
df[df['product-size'] == '800g'][['product-name', 'item-price', 'category']]OPTION C: You can also use the
locmethod to filter the data frame:df.loc[df['product-size'] == '800g', ['product-name', 'item-price', 'category']]This method is similar to the
ilocmethod, but it allows you to filter rows based on a condition (not just by position), and select columns at the same time. RThere are multiple ways to filter data in R.
OPTION A (DISCOURAGED): If we were to use base R, we could use the
subsetfunction:subset(df, `product-size` == "800g")To get a better view of the data, you can subset and select columns at the same time:
subset(df, `product-size` == "800g", select = c(`product-name`, `item-price`, `category`))The
c( )function is R’s way of creating a vector.OPTION B: A better way to filter data in R is to use the
dplyrpackage, part of thetidyverse. Thefilterfunction is used to filter rows based on a condition:df %>% filter(`product-size` == "800g")You can add another pipe (
%>%) to the same line of code to select columns at the same time:df %>% filter(`product-size` == "800g") %>% select(`product-name`, `item-price`, `category`)Filter based on the presence of a certain text in the product name:
PythonWe can use the
str.containsmethod to identify rows of a column that contain a certain string:df[df['product-name'].str.contains('Bread')][['product-name', 'item-price', 'category']] RIn
tidyverse, we have to use an additional function inside thefilterfunction to filter rows based on the presence of a certain text in a column. Thestr_detectfunction from thestringrpackage is used to identify rows of a column that contain a certain string:df %>% filter(str_detect(`product-name`, 'Bread')) %>% select(`product-name`, `item-price`, `category`)
Wrap-up & Next Steps (10 min)
Even if you didn’t finish all the exercises, take some time to share your experiences with the class.
🗣️ CLASSROOM DISCUSSION:
Your class teacher will lead a discussion on the following topics:
Did you find R or Python easier to work with when manipulating tabular data? Or it was the same?
What are the other things you could do with this simple data frame? (Even if you don’t quite know how to do them yet.)
🎁 Bonus tasks
Here are some additional tasks to try. Those are a bit more challenging because they involve combining multiple steps and searching online to understand a bit more of the syntax of the language you are using.
Mini-challenge: Filter the data frame to show all bread products that are of size ‘800g’.
👉 Don’t worry if you can’t figure out this one yet. This will become a much easier task by the end of the week.
Challenge: Rank all sliced breads, of any size, based on their price per gram, from the most expensive to the cheapest.
👉 Don’t worry if you can’t figure out this one yet. This will become a much easier task by the end of the week.
Footnotes
Tabular data is data that is organized in rows and columns (similar but not quite the same as a spreadsheet), where:
- Each row represents a single observation or record.
- Each column represents a variable or attribute of the observation.
Name Age Alice 25 Bob 30 Charlie 22 In this example, the unit of analysis (the thing that each row represents) is a person, and the variables or attributes (columns) are
NameandAge.↩︎A data frame is the standard way to view and work with tabular data in data science. It is a two-dimensional data structure where each column can be of a different data type (e.g., numeric, character, factor). Data frames are used in R (with base R and
tidyverse) and Python (with thepandaslibrary).↩︎