
🗓️ Week 02 – Day 03: Reshaping data for visualisation
A closer look into ggplot2
Dataviz best practices and ggplot2 features.
- Theory behind the grammar of graphics, and ggplot2
- Examples of the most common plots
- Preparing data for ggplot2:
group_byandmutate - Advanced ggplot2 features: themes, scales, and annotations
👨🏫 Lecture Notes
🎥 Looking for lecture recordings? You can only find those on Moodle.
If time allows, by the end of the morning session we will have produced the following plot:
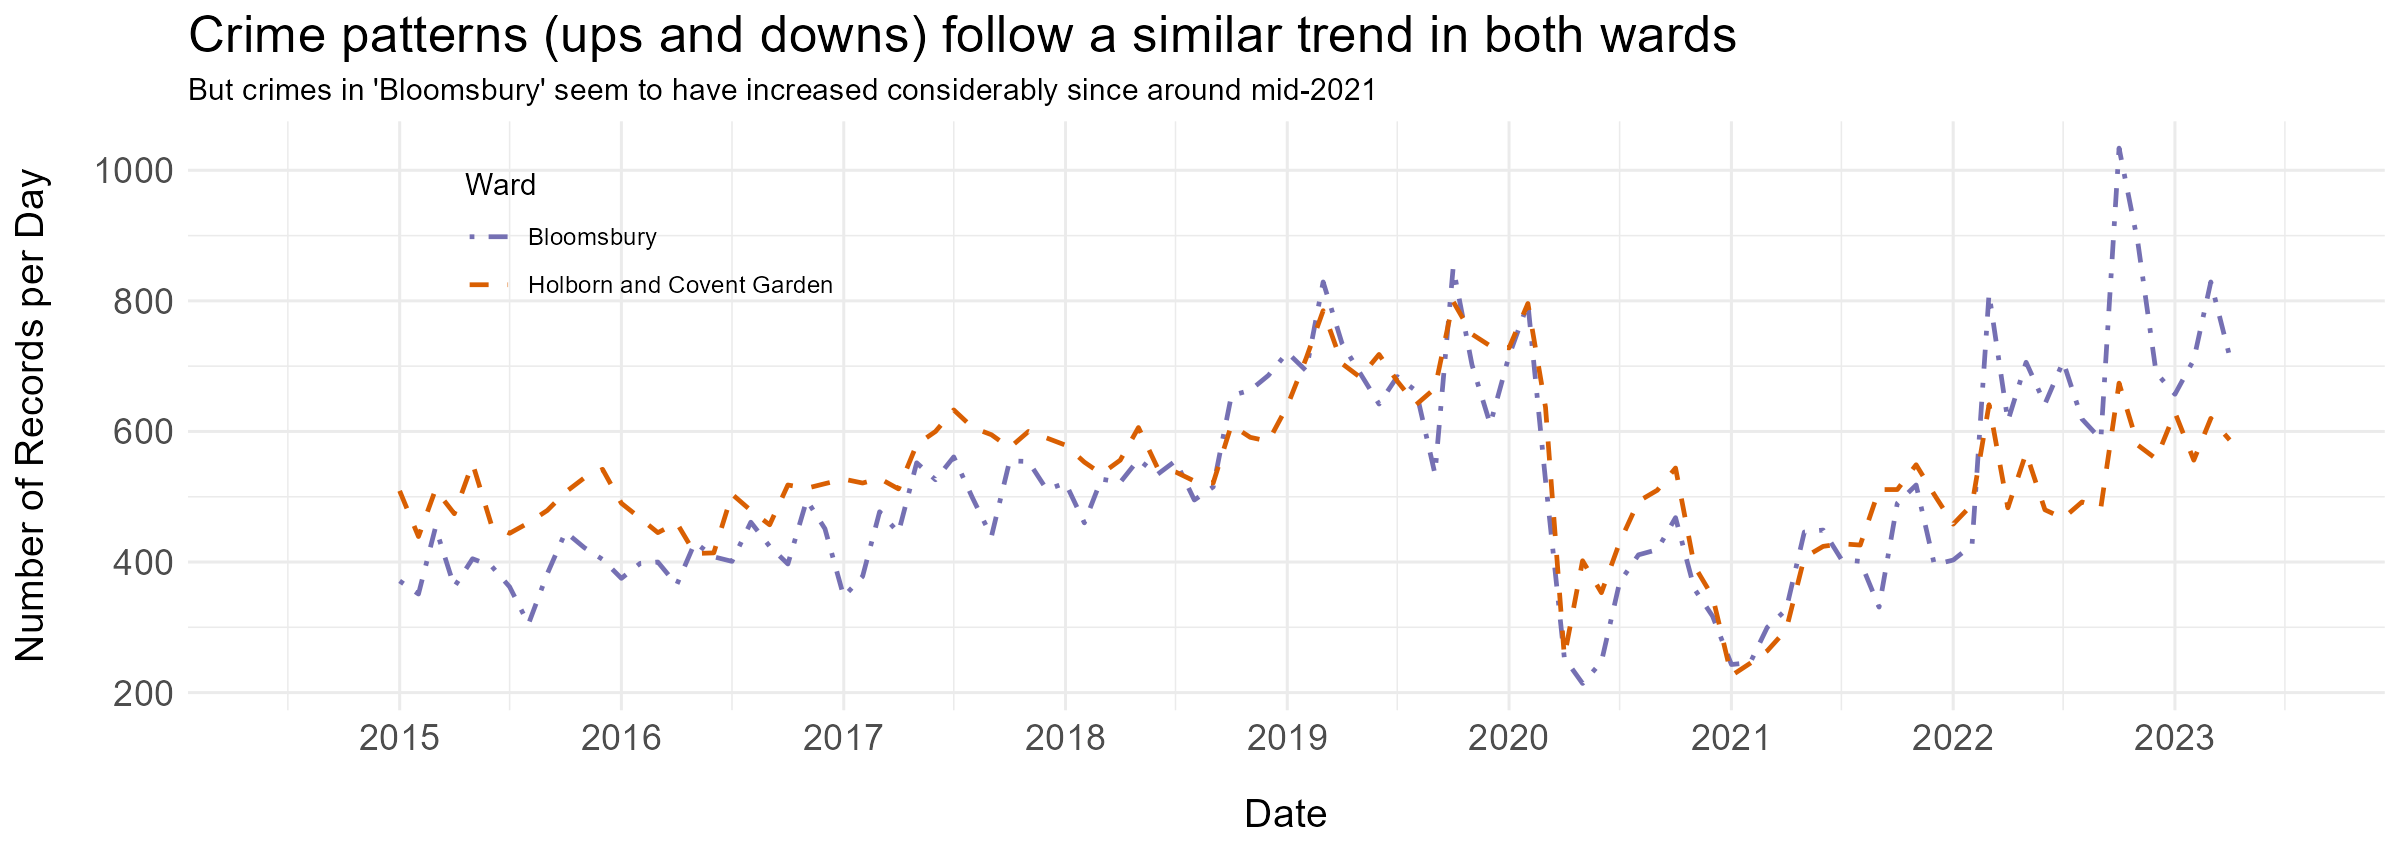
Otherwise, this will be your first task in the lab later today!
You can download the lecture material as a Quarto Markdown file by clicking the button below.
📖 Recommended readings & Revision
The best way to revise is by practising your creativity skills with the Camden crime dataset by yourself. Can you come up with interesting questions to ask to the data? Can you answer them with
ggplot2?R graphics cookbook: practical recipes for visualizing data by Winston Chang (Chang 2018) (freely available online)
ggplot2: Elegant Graphics for Data Analysis by Hadley Wickham (Hadley 2016) (freely available online)