💻 Lab 07 – Data visualisation practice with ggplot2
Week 02 – Day 03 - Lab Roadmap (90 min)
🥅 Objectives
- Put into practice the concepts of the grammar of graphics that you have learned in the morning lecture
- Customise your plots using the
ggplot2package
🖇️ Links to documentation
Packages we’re using today
ggplot2dplyr(for functions likemutate,select,count,group_by,summarise)forcats(for functions likefct_infreq,fct_inorder)scales(for functions to make your plot labels look nicer:comma,percent,dollar)
Other fun packages that you might find useful
ggthemes(for themes liketheme_economist,theme_fivethirtyeight,theme_tufte,theme_wsj)ggrepel(for functions likegeom_text_repel,geom_label_repel)ggforce(for functions likegeom_circle,geom_arc_bar,geom_arc,geom_link,geom_parallel_sets)ggcsi(for different colour palettes, including serious ones likenpgand fun ones likesimpsons)
📋 Lab Task(s)
You are tasked with re-creating the following plots, as close as possible including geom, colours, theme, using only the ggplot2 package.
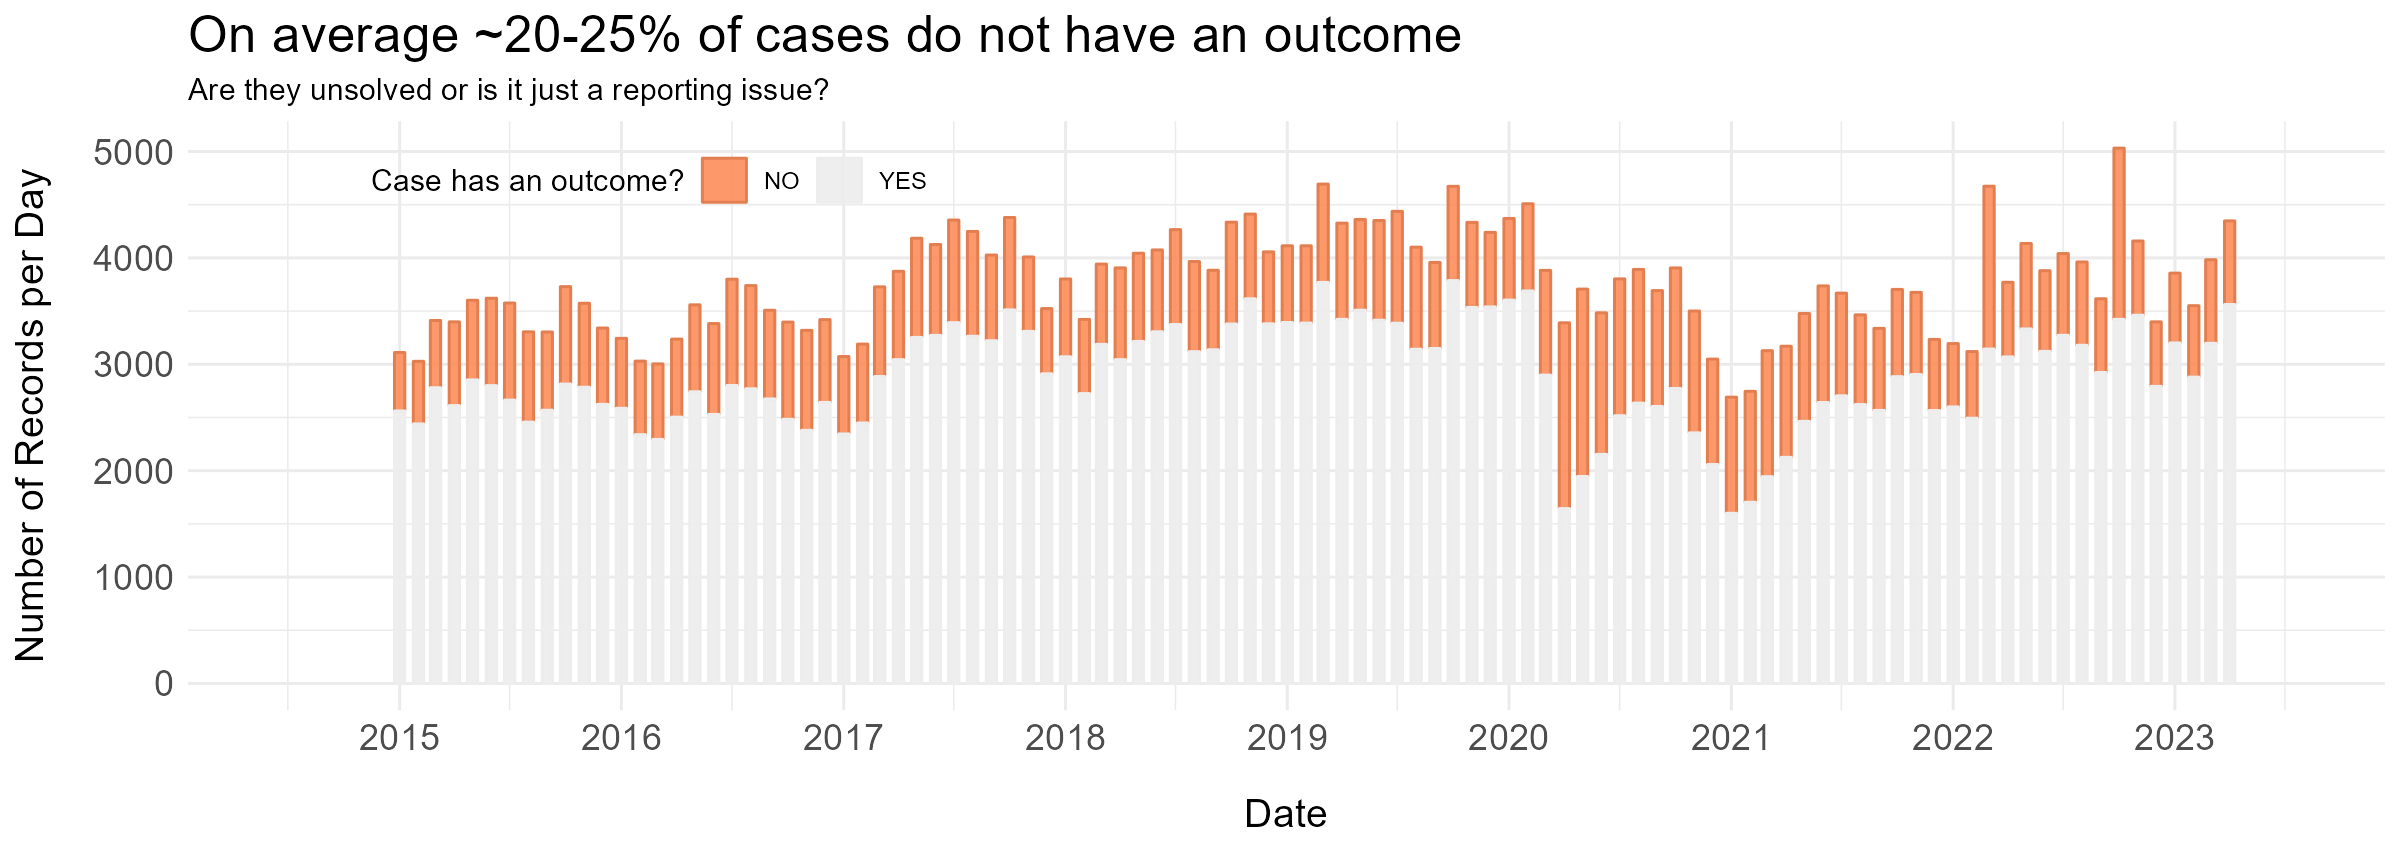
Task 01
(In case we haven’t solved this one in the morning)
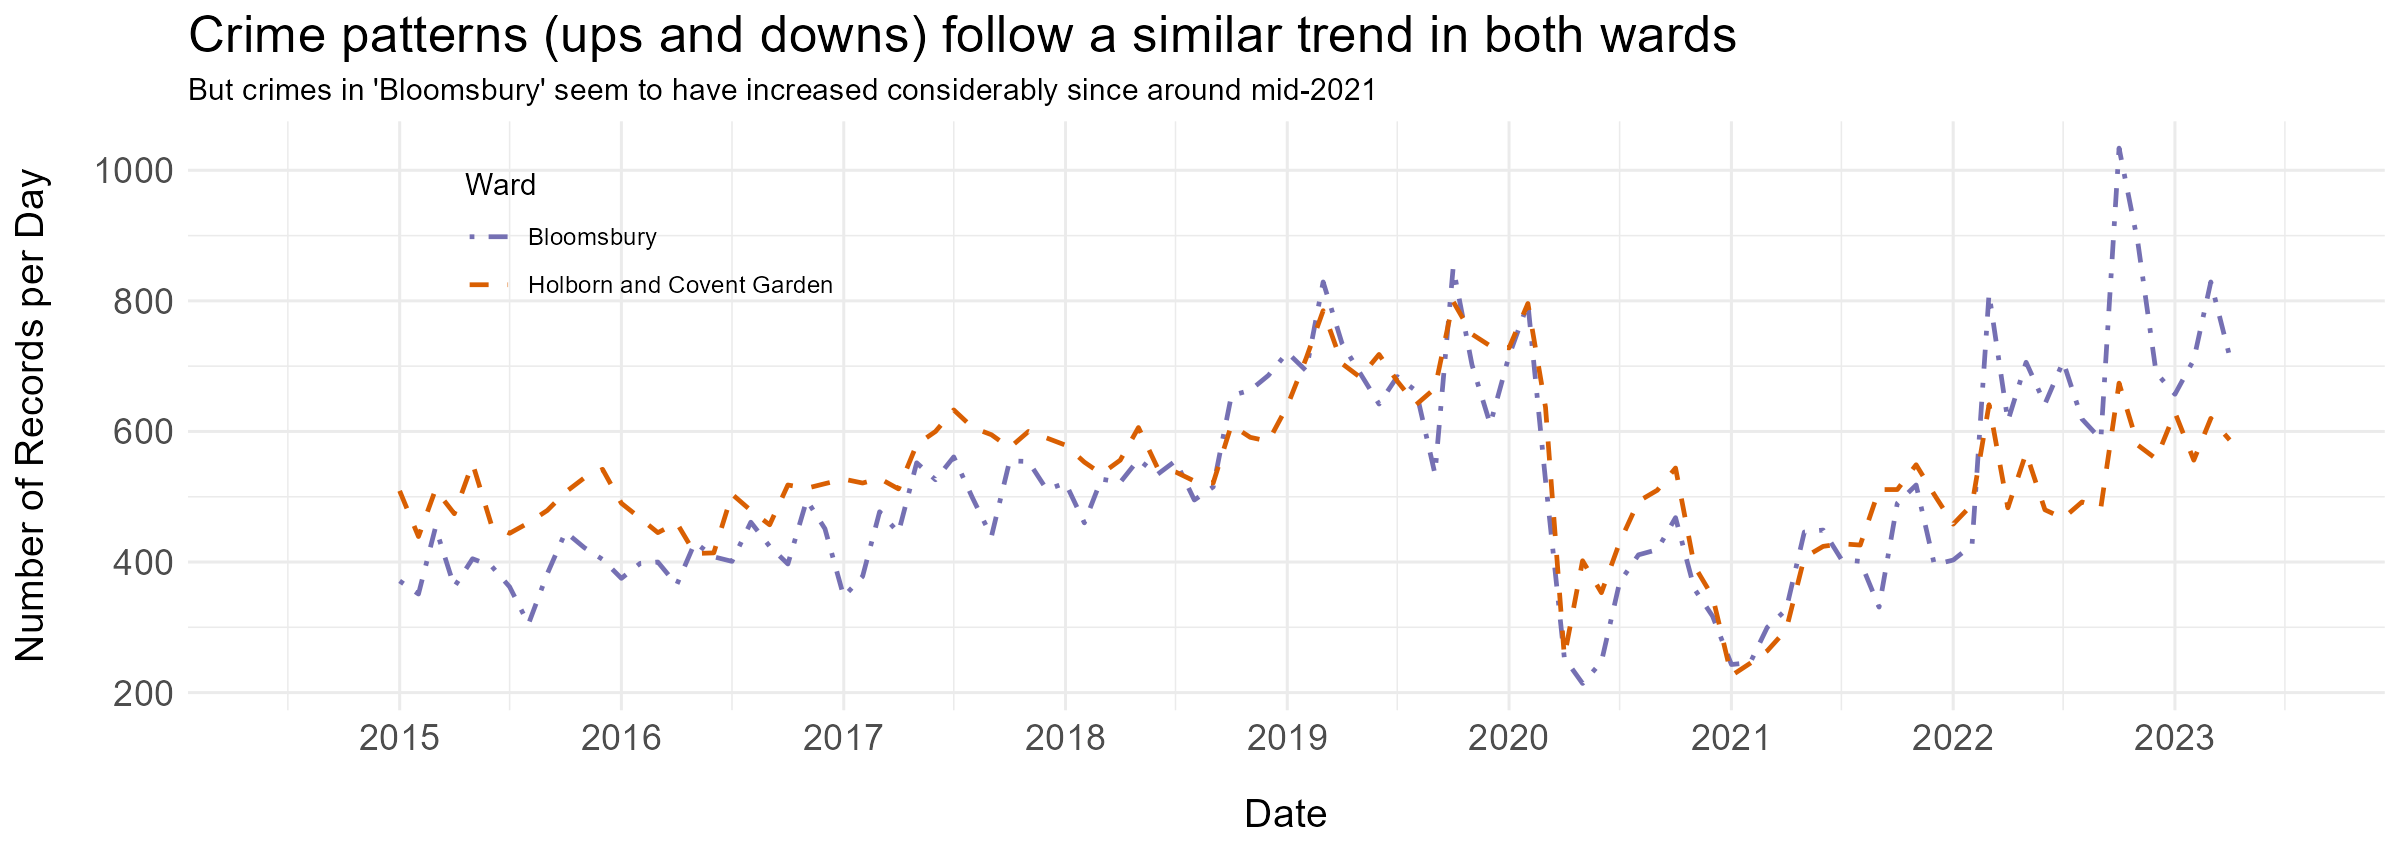
Task 02
How will you add the other lines with a muted grey colour?
And that is it! You have 90 minutes to complete this task. Have fun!
Solutions will be posted on the course website after the lab.
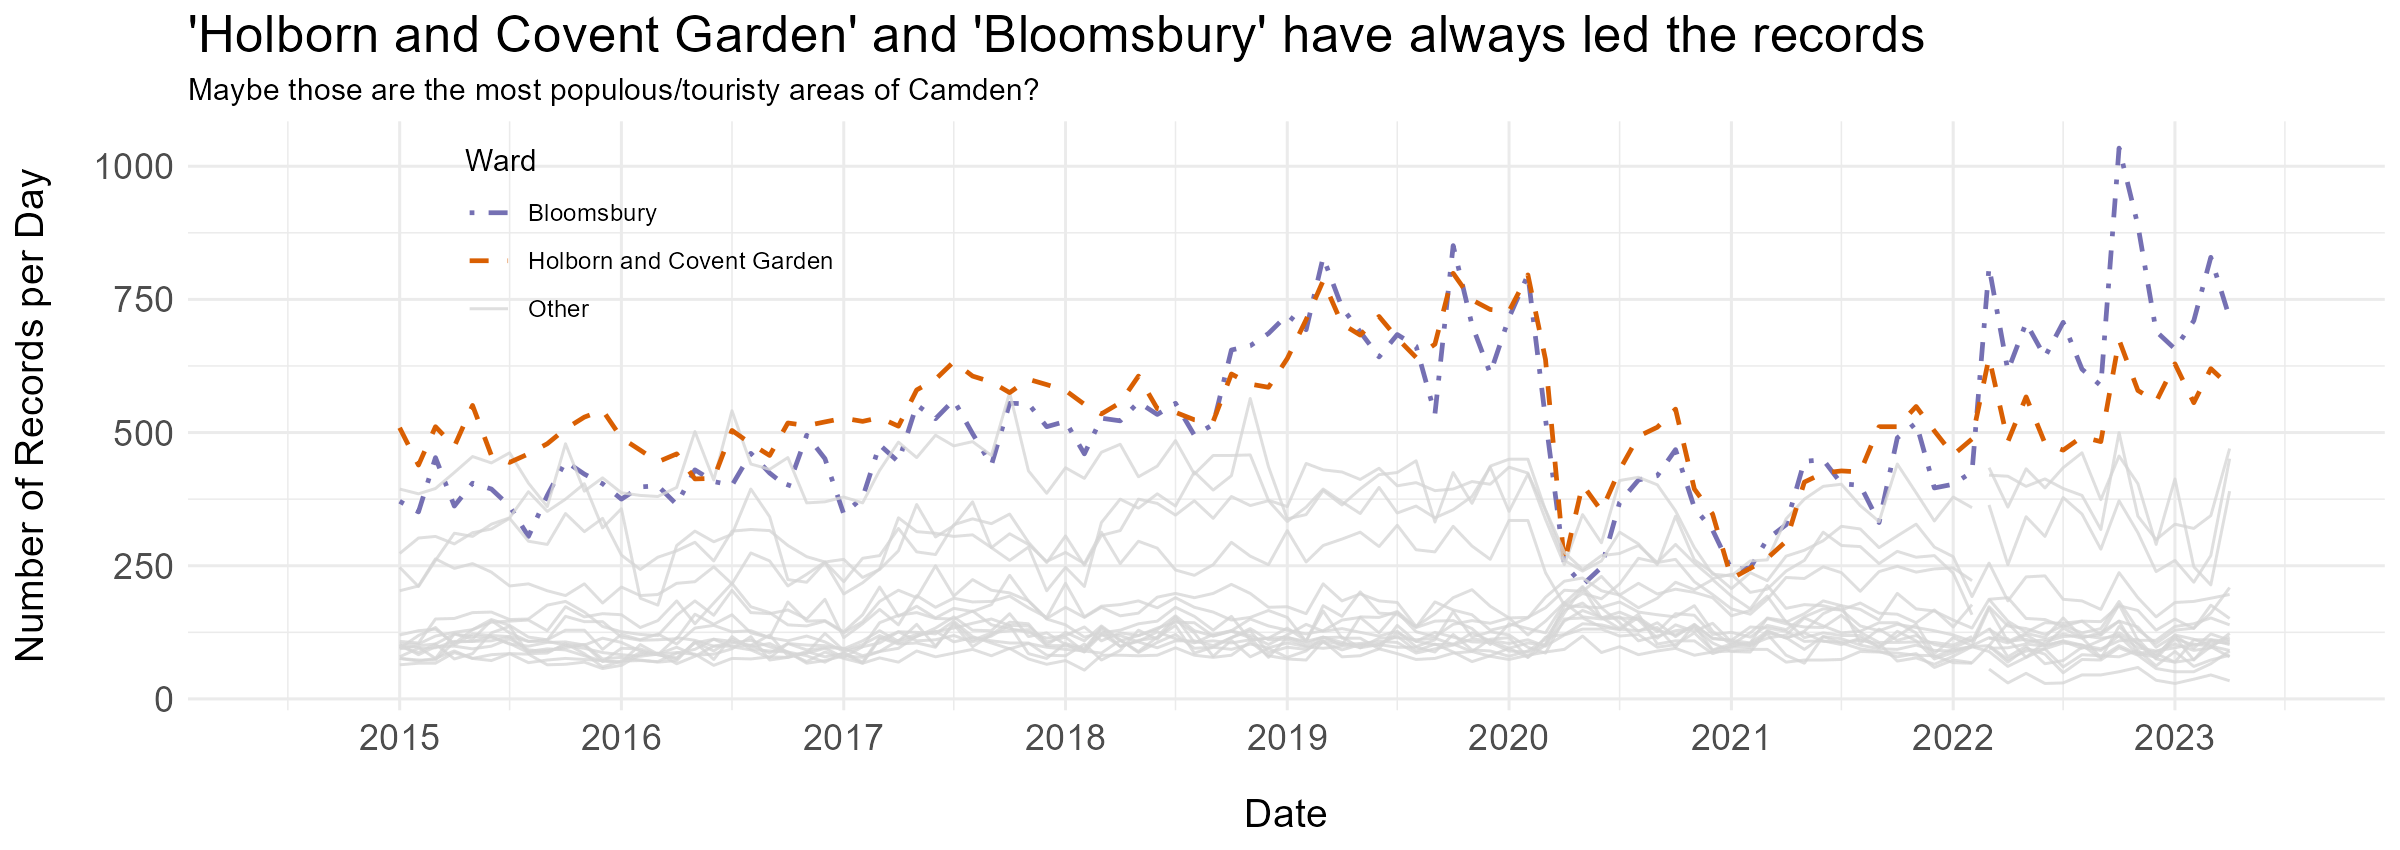
🏡 Bonus Task
Now here is a challenge for you. Can you find a way to reproduce the plot below?