
💻 Week 05 - Class Roadmap (90 min)
2025/26 Autumn Term
Welcome to our fifth seminar/lab class of DS101A.
In this class we will discuss a data-driven approach to setting public policy, using the “Ofqual debacle” as a case. First, your teacher will discuss how to interpret linear regression, the same model which formed the basis of the Ofqual algorithm.
Interpreting linear regression: a primer (20m)
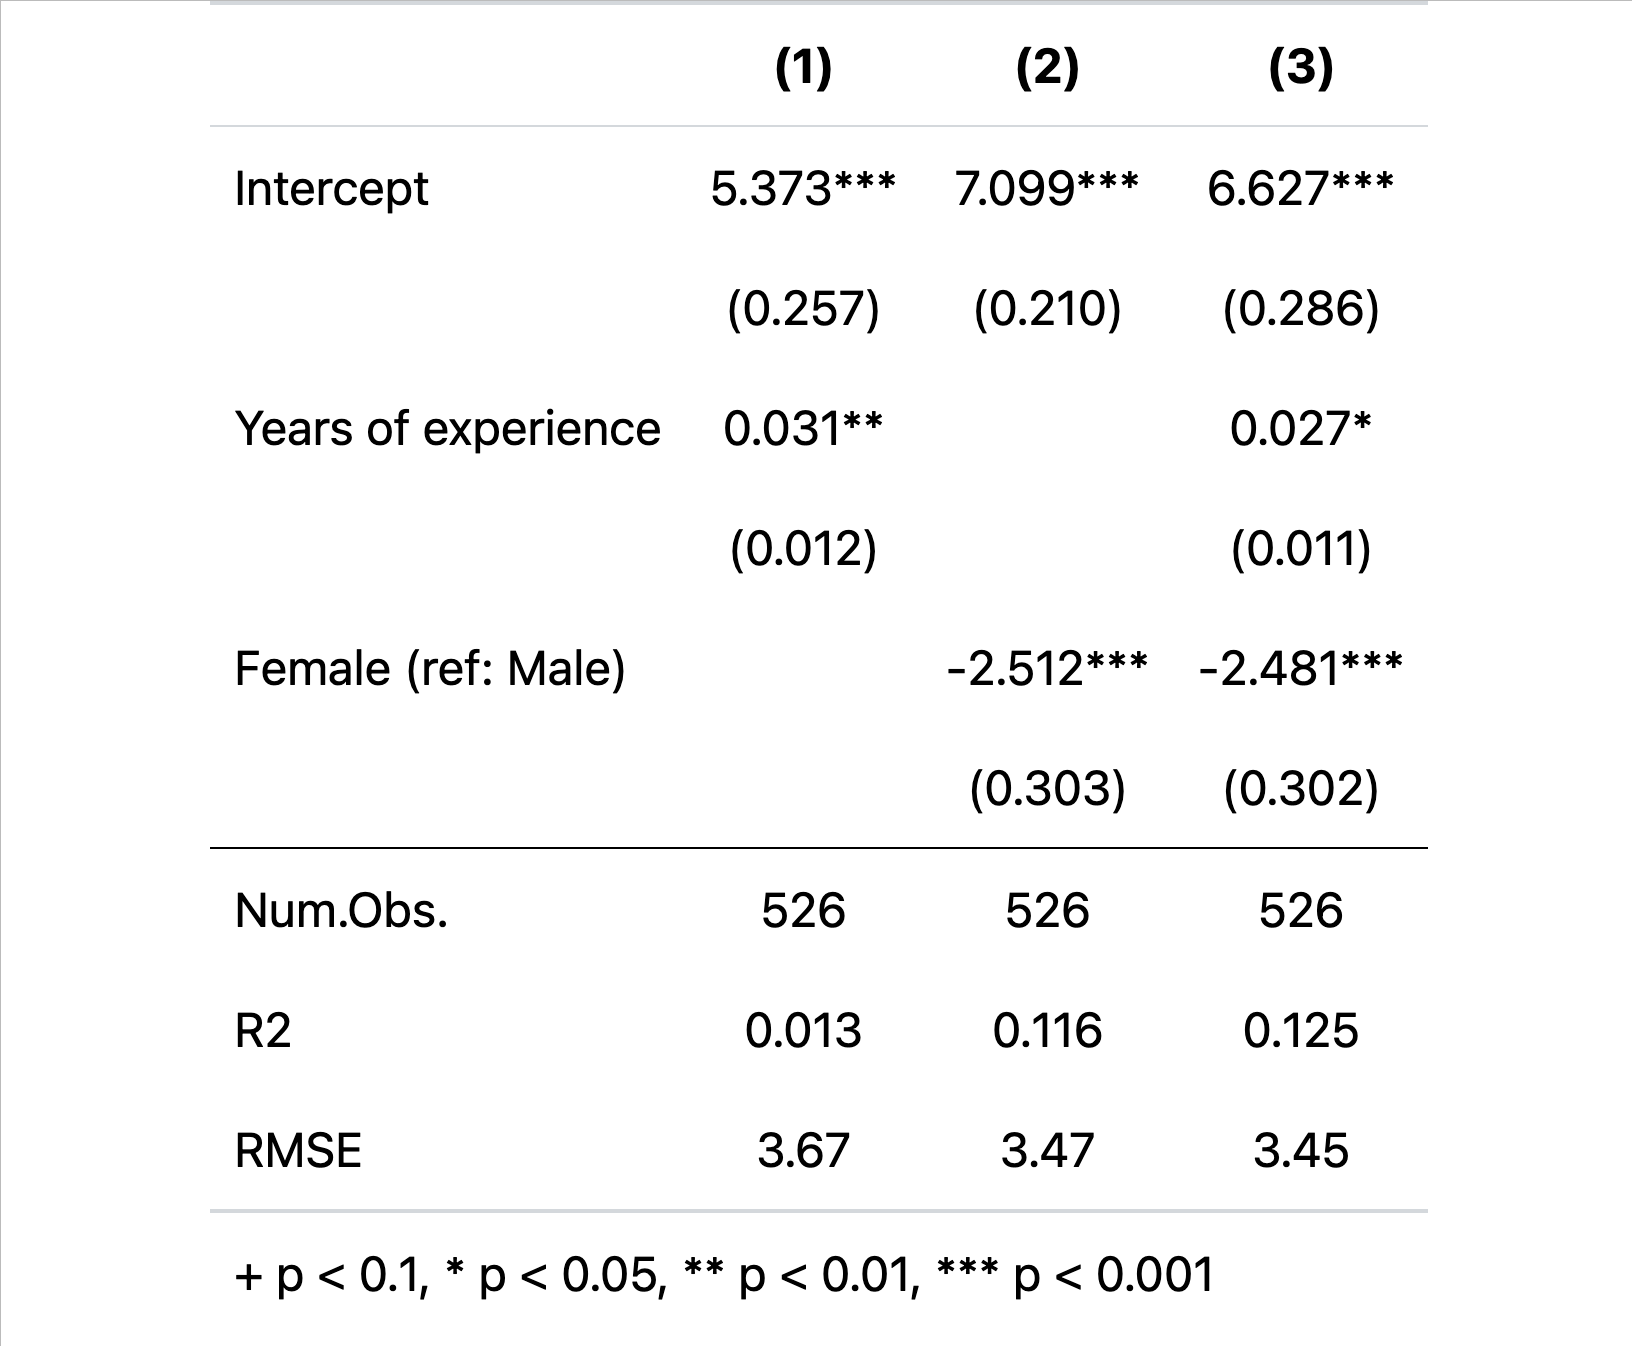
Below, we can see a basic example of a linear regression model. The target (a.k.a. the outcome or the “dependent variable”) is hourly wages in US dollars. Things to point out:
Models are a simplification of reality. Many many things influence wages that we have not included. Yet while all models are “wrong”, as the saying goes, some models are nevertheless “useful”. However, some models are not only “wrong” but also deceptively so.
Correlation does not equal causation. Models supply predictions but without employing a convincing identification strategy, we will always be left wondering whether a feature (a.k.a. independent variable) causes an outcome and, if so, to what extent.
Linear regressions assume a linear relationship between a continuous feature and an outcome. This produces easy to understand “quantities of interest” but, in reality, the relationship may be more complex. Discuss the “Years of Experience” feature.
Categorical outcomes can be included. These give us the estimated change in the outcome relative to a reference category. Discuss the “Female (ref: Male)” feature.
Models, particularly, linear models can assess (a) relationships between features and outcomes and (b) goodness of fit. All models used in machine learning can assess goodness of fit, but not all are as interpretable as linear regression. There may be a interpretability-flexability trade-off in this regard. Discuss R-Squared and Root Mean Squared Error (RMSE).
Ofqual’s Direct Centre Performance model
The examination centre provided a list of teacher predicted grades, called ‘centre assessed grades’ (CAGs).
The students were listed in rank order with no ties.
With exams with a large cohort; the previous results of the centre were consulted. For each of the three previous years, the number of students getting each grade (A* to U) is noted. A percentage average is taken.
This distribution is then applied to the current years students-irrespective of their individual CAG.
A further standardisation adjustment could be made on the basis of previous personal historic data.
The formulas
For large schools with \(n\geq 15\)
\[ P_{kj} = (1 - r_j)C_{kj} +r_{j}(C_{kj} + q_{kj} - p_{kj}) \]
For small schools with \(n<15\)
\[ P_{kj}={\text{CAG}} \]
\(n\) is the number of pupils in the subject being assessed
\(k\) is a specific grade
\(j\) indicates the school
\(C_{kj}\) is the historical grade distribution of grade at the school (centre) over the last three years, 2017-19.
\(q_{kj}\) is the predicted grade distribution based on the class’s prior attainment at GCSEs. A class with mostly 9s (the top grade) at GCSE will get a lot of predicted A*s; a class with mostly 1s at GCSEs will get a lot of predicted Us.
\(p_{kj}\) is the predicted grade distribution of the previous years, based on their GCSEs.
- You need to know that because, if previous years were predicted to do poorly and did well, then this year might do the same.
\(r_{j}\) is the fraction of pupils in the class where historical data is available.
- If you can perfectly track down every GCSE result, then it is 1; if you cannot track down any, it is 0.
\(\text{CAG}\) is the centre assessed grade.
\(P_{kj}\) is the result, which is the grade distribution for each grade \(k\) at each school \(j\).
Step 02 - Class Intuitions on OFQUAL (above) (5m)
- Based on the reading, was the OFQUAL algorithm a good idea?
Step 03 - The problem and solution design (20m)
What is the problem of “fairness in exam grading” being described here – can you articulate what that means – and why it requires analytical consideration?
Do you have any questions about the algorithm as described?
- Can you identify any design strengths of the Ofqual algorithm?
- Can you identify any design weaknesses of the Ofqual algorithm?
- Can you qualify the role of teachers in predicting course grades?
- What’s good about subjective considerations?
- What’s problematic with subjective considerations?
- In your view, does public opinion reflect (i.e. is it consistent with) the strength and weaknesses?
Discuss with your neighbours
Share your insights with the wider class
🍵 Break (~5 min)
Step 03 - Quality (15m)
- Did the algorithm meet the brief?
- .. to “ensure, as far as is possible, that qualification standards are maintained and the distribution of grades follows a similar profile to that in previous years”
- Teacher rankings were taken into consideration, but not the teacher-assessed grades submitted by schools and colleges (at least not for classes of sizes higher than 15 students)
- Was the algorithm’s brief appropriate?
- Was the algorithm an accurate simplification of reality?
- Was the algorithm just?
Step 04 - Alternative approaches to the same problem (15m)
- Discuss the approach taken in Scotland and Ireland?
Step 05 - What do you think? (10m)
- Can a better version of the OFQUAL algorithm be designed?