
📝 Week 01 Practice Exercise
2025/26 Autumn Term
Ideally, everyone should finish this exercise before the 🖥️ W01 Lecture!
This practice exercise should take about 2 hours to complete. It gives you access to the relevant platforms we will use in the course to work on course materials and to communicate with each other.
You will also get a feel for how data analysis is done in practice using a type of document called a Jupyter notebook.
Task 1: Joining and interacting on  Slack
Slack
⌚ Time estimate: 10-20 minutes
Slack will be our main communication hub for DS105A. Students consistently tell us it helps them connect with peers and get quick help with course questions.
🎯 ACTION POINTS
🗒️ NOTE: Whenever you see the 🎯 ACTION POINTS text, it means you have a set of tasks to complete. This will also be the case in the course materials.
- Join the DS105A Slack workspace using your LSE email address:
Visit our ![]() Slack group
Slack group
New to Slack? Use this invitation link1.
Set up your profile with your preferred name and, if possible, upload a photo of yourself so we don’t feel we are talking to a generic avatar. A photo helps us connect names to faces, especially when following up on in-class discussions!
Read the pinned messages on each of the channels:
#announcements: Course updates#social: General discussion and peer interaction#help: Course-related questions- The group channel related to your Friday labs (
#class-group-X). Find it under More > Channels
IMPORTANT: Perform at least one interaction in the
#socialchannel to show us that you have understood how to use Slack messages.Here’s how to perform this task:
- Click on the
#socialchannel. - Scroll up to see if anyone from the same degree programme and year as you has introduced themselves.
If you are the first to post, you can write something like:
Hi everyone in this @channel 👋
First-year BSc Economics student here! (DS105A will be my first coding course!)
If someone from your year and programme has already introduced themselves, click on their message and reply to it. For instance:
Same here! In my case, I already have some experience with coding in Python but not related to data science.
If you are a General Course or Exchange student, it will be good to hear where you are from and what you are studying in your home institution!
- Click on the
Task 2: Get into Nuvolos
⌚ Time estimate: 20 minutes
While you could run code on your own computer, it might take a long time to get all the software set up correctly. That is why in this course we will use a cloud-based platform called Nuvolos that allows you to run things smoothly directly from the browser.
🎯 ACTION POINTS
- Get access to Nuvolos:
Access ![]() Nuvolos
Nuvolos
First time? Follow the Nuvolos First Time guide very carefully.
Click around and get familiar with the interface:
Read and follow the instructions in
 Using Nuvolos to help you understand the interface.
Confused about Nuvolos? Post a question in #help on Slack. We mean it! We feel very happy when we can help you out via Slack. Even better if we see students helping each other out!
Task 3: Meet the Jupyter Notebook Format
⌚ Time estimate: 30 minutes
There are many different ways to write code, but one of the most popular in the world of data science is called a Jupyter notebook. It is a document that contains both code and text. These files have the identifying filename extension: .ipynb.
🎯 ACTION POINTS
Open VS Code on Nuvolos.
Go to the
 Applications tab on the left-hand side of the Nuvolos interface and click on the
  VS Code application in the list.
Familiarise yourself with the
VS Code interface:You should see a screen that looks similar to this:
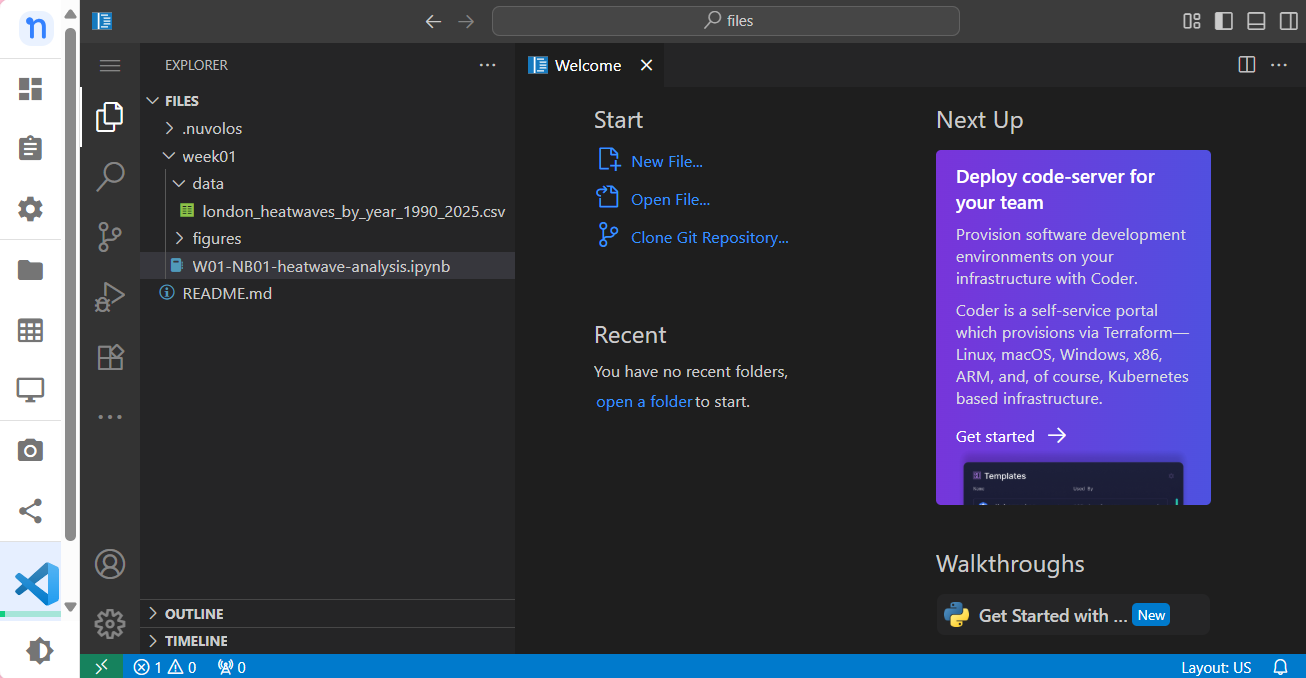
Figure 1. The VS Code app opened on Nuvolos showing the files in the week01folder.🤔 Think about it: What happens when you click on the
 and
and  icons that you see in the screenshot above? For example, what happens when you click on the icon next to the
 week01folder?
![]() Nuvolos vs
Nuvolos vs ![]() Visual Studio Code (aka VS Code)
Visual Studio Code (aka VS Code)
- Nuvolos is like a computer that lives in the cloud in which we pre-installed some apps so you don’t have to waste time installing them on your own computer.
- VS Code is one of the apps we installed there. It is a popular code editor used by professional software developers to write code.
Open the Jupyter Notebook. Click on the
W01-NB01-heatwave-analysis.ipynbfile that is inside theweek01folder.The notebook will appear on a separate tab in VS Code.
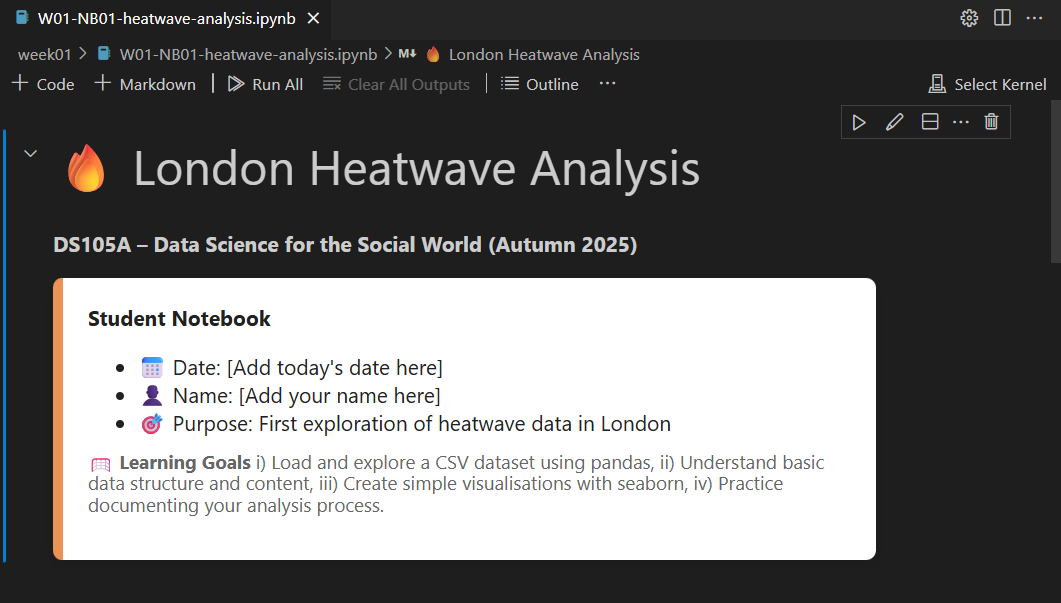
Figure 2. The first cell of the notebook in VS Code (rendered) If you double-click the first piece of text in the notebook, you will see the same content but in a different format and with some added characters. It will look something like this:
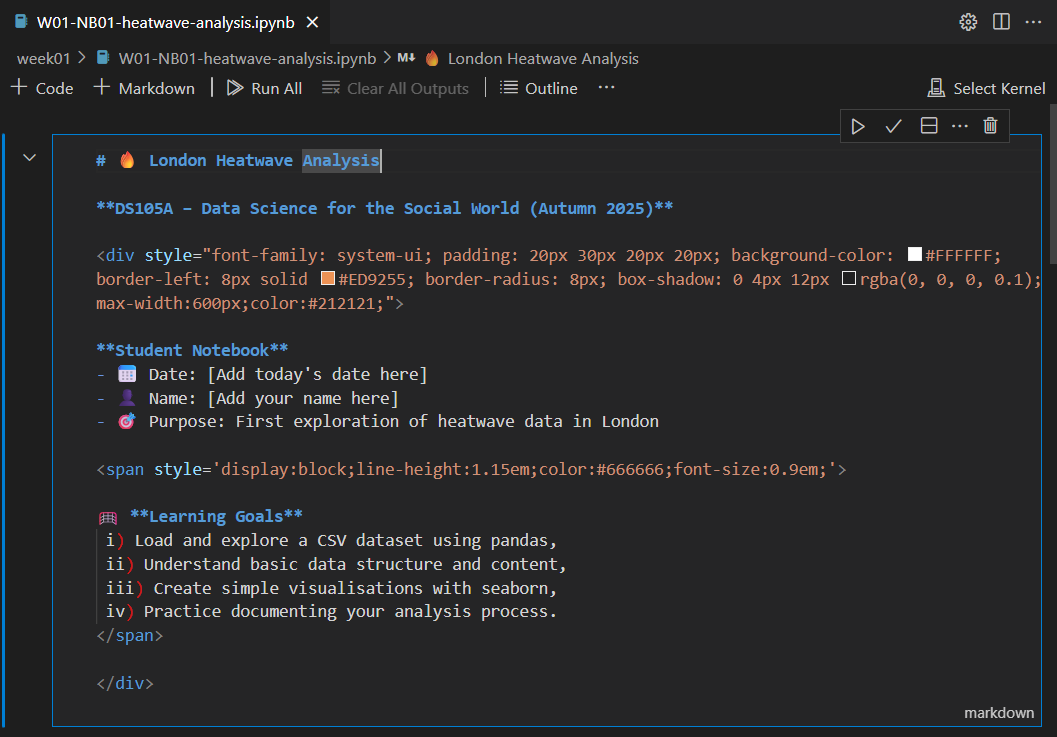
Figure 3. The first cell of the notebook in a different format (source code) What you see here is the source code of the first cell of the notebook. It is a computer code of a language called Markdown that tells the computer how to format the text. Where you see
#at the beginning of the piece of text, it signals that the text is to be treated as a big title (the big heading, or H1) and where you see**around some text, this indicates that the text should be put in bold. You will use a lot of Markdown in this course!📑 Bookmark the Markdown Guide | Basic Syntax page somewhere safe so you can come back to it later when writing your own Markdown texts.
Edit the first cell of the notebook. Edit the source code of the first cell, remove the
[Add today's date here]placeholder text and replace it with the current date. Do the same to the[Add your name here]placeholder text and replace it with your name.Save the changes by hitting ‘Ctrl + Enter’ on your keyboard or by clicking on the
 check symbol in the top-right corner of the cell.
![]() Markdown and
Markdown and ![]() Code cells: The two types of cells in a Jupyter Notebook
Code cells: The two types of cells in a Jupyter Notebook
A Jupyter Notebook is split into multiple blocks of either formatted text or computer code. We call these blocks cells.
- You already interacted with a
 Markdown cell. As you know, these cells contain content that gets converted automatically into nicely formatted text if you use the right Markdown syntax.
 - The other type of cell is a
 Code cell. We use it when we want to write computer code that will be interpreted and run by the computer. There are tons of different programming languages out there, and Jupyter supports many of them, but in this course we will use the popular
  Python programming language.
Run the first code cell.
Scroll down to the first code cell and run it by either hitting ‘Ctrl + Enter’ on your keyboard or by clicking on the
 run symbol on the top-left corner of that cell. You should see the output of the Python code cell right below it.
Run all the code cells in the notebook.
At the top of the tab of the notebook, you will see a
 Run All button. Click on it to run all the code cells in the notebook at once, from top to bottom. You should see the output of all the code cells right below them and there should be no error messages.
Task 4: Reflect on the data analysis
⌚ Time estimate: 30 minutes
The notebook contains code to perform the analysis of the number of heatwave days in the UK per year since 1990. Whether you are a beginner or an experienced programmer, don’t focus too much on understanding the code itself.
You will gain more by thinking about whether the data analysis reveal anything interesting.
If you are a coding beginner: keep engaging with the weekly practices, asking questions in the lectures, labs or on Slack and attending office hours with any teaching staff in case you feel stuck. Stick to this strategy and by Week 03, you will have acquired the knowledge and skills to write your own code for this type of analysis.
🎯 ACTION POINTS
- Read the content of the notebook (Sections 1 - 4) and fill in the reflection cells throughout.
DO NOT worry about understanding the code.
For now, just focus on understanding, at a high level, what we are trying to achieve in each section of this notebook. You will learn more about Python soon.
- Dedicate special time and attention to the task of giving a title and subtitle to the plot.
Task 5: “Can’t an AI do this?”
⌚ Time estimate: 20 minutes
I run a similar course to DS105 in the LSE Summer School (ME204). During our first lecture when I was explaining the different stages of a data analysis (collect the data -> clean it up -> put it on a suitable table -> analyse it -> interpret -> communicate the results via a plot or a table), one student raised their hand and asked: “Can’t we just get an AI to do all of this though?”.
This prompted me to ask the class to try it out themselves and our discussions were really fun and insightful so I want you to have a similar experience!
In this course, you are allowed to use AI for anything in your coursework. We don’t “penalise” students for using AI. Be mindful however that if you use AI as a substitute for your own thinking (AI-driven ‘brain rot’), you won’t go super well in this course. If you use AI, try to be in control of the process and don’t let AI’s suggestions take over from you.
DS105’s graded coursework are designed such that we value more the process of learning than to the final outcome of the work and therefore, it becomes clear to us if - with or without AI - you are learning and thinking.
🎯 ACTION POINTS
Please follow the instructions below, adding your own reflections to the notebook. We will invite you to share your thoughts on this topic in the 🖥️ W01 Lecture and 💻 W01 Lab after you have completed this practice exercise.
- Open an AI chatbot - preferably the Claude available for free to LSE students.
Access Claude for Education
First time? Click on ‘How do I access Claude?’ and follow the instructions.
Join the DS105A (2025/2026) Claude Project
After registering with LSE Claude, reply to this Slack message saying “add me to the project please!” to get access.
Ask the AI to do the analysis for you.
Ultimately, we are looking to answer the question:
“Has the frequency of heatwave days in London increased or decreased since 1990?”
👉 Feel free to modify the question when interacting with the AI, and to follow up on its answers to direct it to do things differently. Just don’t give the AI any data, such as the CSV file containing the data. Our goal is to see if AI ‘alone’ can do everything for us: collect -> clean -> analyse -> interpret -> communicate and whether we can trust its results.
Claude should already have Web search enabled by default. Click here to learn how to enable it in case it is not the case.
🤔 Think about it: Did the AI give the same answer as you when you ran the analysis in the notebook? How good/bad was it? If it was correct, how did it do it? If it was incorrect, why? Write your answers in the reflection cells throughout the notebook.
Can the AI generate a good title+subtitle for the plot?
Now, open a completely new chat with the AI and explain the data analysis we did in the notebook, upload the image of the plot to the chat and then ask the AI to generate a good title and subtitle for the plot.
🤔 Think about it: Were the AI’s title and subtitle any good and in line with how we want titles and subtitles to look like in this course? Also, how does this more targeted task compare to the one you did in the previous task? Add your answers in the reflection cells throughout the notebook.
Looking at the W01 Practice material and the Jupyter notebook, I can see the pedagogical approach focuses on clear action points, reflection, and progressive skill building. Here’s the additional task for Task 5 that aligns with the existing style:
Task 6: Document Your AI Experience
⌚ Time estimate: 10 minutes
Now that you’ve experimented with AI, let’s document your experience directly in the notebook itself. This will help you practice working with Jupyter notebooks while reflecting on what you’ve learned.
🎯 ACTION POINTS
Add a new Markdown cell to your notebook.
Hover your mouse over the last cell in the notebook. You should see a small
+button appear that lets you add either a code cell or a Markdown cell. Click on the+button and select Markdown to add a new text cell.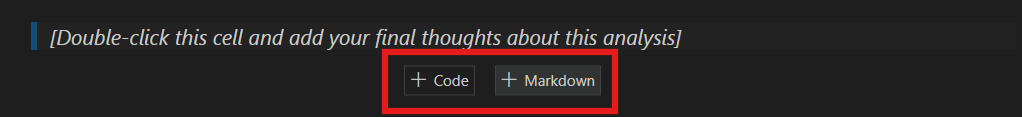
Figure 4. Adding a new cell in VS Code. Create Section 6: My AI Experience
In your new Markdown cell, add the following content:
## Section 6: My AI ExperienceThen write about your experiences and responses to the reflection questions we asked in the Task 5 above. Have fun with the Markdown formatting!
Add screenshots (optional but fun!)
If you want to show what the AI produced, you can upload screenshots to your notebook:
- Right-click on the
figuresfolder in the left-hand panel of VS Code - Select Upload and choose your screenshot
- In your Markdown cell, add the image using:

🤔 Think about it: How does documenting your AI experience help you understand both the strengths and limitations of AI tools for data analysis?
- Right-click on the
Appendix | Resources, links, etc.
Relevant online tutorials:
- Using Slack
- Jupyter Notebooks in VS Code
- Take a look at the AI Fluency course to learn how to use AI more effectively.
Support this week:
- Slack: Post questions to
#helpand help each other out! Staff will check Slack at specific times during the week. - Office Hours: You can book a 1:1 session with the teaching staff via StudentHub. Just search for our names there.
Footnotes
The Slack link is private and only available on Moodle↩︎