
✍️ Mini-Project 1 (20%): Air Quality Analysis
2025/26 Winter Term
This is your first graded summative assignment, worth 20% of your final grade in this course.
📚 Key Info
| ⏳ | DEADLINE | Thursday, 26 February 2026 (Week 06, Reading Week) at 8 pm UK time |
| 📂 | Repository Setup | GitHub Classroom Repository (link on Moodle) |
| 💎 | Weight | 20% of final grade (1/3 of the COURSEWORK component) |
| 📝 | Prerequisite | This assumes you are caught up with the course up until Week 04 |
| ⬆️ | Submission | Simply git push your changes to your allocated GitHub repository before the due date. We will mark you based on the latest version of what is in your GitHub repository.🚨 Don’t leave it to the last hour! GitHub is set up to automatically forbid any git push past the deadline!DO NOT submit anything via Moodle or email. We will only mark what is in your GitHub repository. |
📝 Your Assignment
The Question
You’ve been commissioned by the fictitiously famous Office of Quirky Inquiries (OQI) to answer the question 1:
“Does London’s air clean up on weekends?”
Your goal is to analyse whether London’s air pollution follows different patterns on weekdays versus weekends, using the OpenWeather Air Pollution API.
The Data Source
This time, we will switch to a different API called OpenWeather.
- OpenWeather general API page: https://openweathermap.org/api
- Air Pollution API page: https://openweathermap.org/api/air-pollution
Note: The OpenWeather website provides multiple API endpoints (the base_url you use to construct the API request). You will need to figure out which one provides the historical air pollution data you need.
📌 DECISIONS, DECISIONS, DECISIONS
You will need to make several decisions independently:
- API endpoint: Which
base_urlprovides the historical air pollution data you need? - Time horizon: What time period will you analyse? (The API provides hourly data from November 2020 onwards.)
- Location: Which specific location in London will you use? Will you collect data just for a specific central location, or for multiple locations within London at once?
- Pollutants: Which air quality metrics will you focus on? (PM2.5, NO₂, O₃, CO, etc.) You may want to do some research about which pollutants are most likely to differ between weekdays and weekends, and why, or just simply work with all of them and let the data speak for itself. Your call.
- Weekend definition: What counts as a “weekend”? Just Saturday and Sunday or should Friday evening count? Should we also include public holidays?
- Temporal aggregation: Hourly averages by day-of-week? Daily means/medians? Something else?
- Categories: Will you use OpenWeather’s index levels or define custom thresholds?
If you define custom air quality categories or thresholds, then you must cite official government sources (e.g., UK DEFRA, WHO guidelines) or academic literature to back up your choices.
In your notebooks (you decide where it’s most appropriate) document your decisions and explain your reasoning. Whatever it is you discovered or where you gathered information from (search engines, AI chatbots, etc.), how did that inform your choices and technical implementation?
The Specifics
In terms of the files you have to have in your repository, you will need to:
- Collect historical air pollution data through API authentication and save it to a JSON file (
NB01-Data-Collection.ipynb). Make sure the data is saved to adata/folder inside your repository.
Click here to see more details on the data collection process
You will come across two major new concepts when looking at the NB01-Data-Collection.ipynb notebook: API keys and the notion of a .env file.
Learning to decypher documentation is a key skill in this course and so the expectation is that you should be able to engage with these new concepts just by reading the instructions in the NB01 and/or by reading the relevant documentation. In case you feel confused, remember to use #help channel on Slack and know that we will also reinforce these concepts in the 🖥️ W05 Lecture.
API keys: These are like secret passwords to access data from a server. In the past, we didn’t need any passwords to connect to OpenMeteo, but we also got locked out of the API because we were sending too many requests! By using an alternative API that requires authentication, we can avoid this problem as each request is uniquely tied to your e-mail address.
.envfiles: These are standard way to store sensitive information (like API keys) outside your code. They are ignored by Git by default, so you don’t need to worry about them being shared with the world.
(More on why I do things this way in the Figuring Things Out section below.)
Transform raw API responses into a tabular format using vectorised operations and save it to a CSV file (
NB02-Data-Transformation.ipynb). Make sure the data is saved to adata/folder inside your repository.Read the CSV file created in the previous step and produce two analytical insights about weekday vs weekend air quality patterns (
NB03-Data-Analysis.ipynb). If you produce any figures, you can save them to afigures/folder inside your repository.
Your two insights should address different aspects of the weekend question (e.g., which pollutants differ vs when during the day the difference is largest). Two visualisations of the same finding in different chart types do not count as two separate insights. Read the Technical Requirements section below for more details.
- Update the
README.mdfile that came with your repository. Replace the placeholder sections with a brief overview of your project following the template provided.
There are some other technical requirements that you should be aware of before you start. Keep reading to find out more.
📚 Getting Started
⚠️ First of all, make sure you are caught up with the course.
This assignment assumes you have worked through all prior weekly exercises including 📝 W04 Practice. If you are behind, check the ✋ Contact Hours page or start a fresh chat on the ![]() DS105W Claude Project and type “Help me catch up!”.
DS105W Claude Project and type “Help me catch up!”.
Then follow these steps in order:
Step 1: Set Up Your AI Chat Log
🤖 AI Policy Reminder: The use of AI tools is fully authorised in this course. You are not penalised for using or not using AI in your DS105W coursework.
Open a fresh chat window(s) for this assignment. Together with your code and reflections, your chat log(s) helps us provide better feedback on how you’re using AI as a learning tool.
Tools you could use:
- ChatGPT (OpenAI)
- Gemini (Google)
- Claude (Anthropic)
- ⭐️ My recommendation: the
 DS105W Claude Project I have curated to help with your DS105W coursework.
How to start: I recommend you start the chat with something like: “I will use this chat for the ✍️ Mini-Project 1, as part of the LSE DS105W (2025/2026) Data for Data Science course.” When you’re done, export the chat log link and include it in one of your notebooks.
Step 2: Accept and Clone Your Repository
The next step is to accept the GitHub Classroom assignment. This is the same procedure you followed when you did the 📝 W04 Practice assignment. You will be taken to a page where you will have to click on a button that says something like ‘Accept the assignment’. After accepting, a personalised GitHub repository will be created for you. Grab the SSH URL from there.
![]() GITHUB ASSIGNMENT INVITATION LINK:
GITHUB ASSIGNMENT INVITATION LINK:
https://classroom.github.com/a/RdDGCVLN
🐞 GitHub Classroom Bug: If after accepting the assignment you see an error saying you don’t have permission or something similar, don’t panic! The repository has likely been created successfully. You can verify by visiting https://github.com/lse-ds105/mini-project-1-<username> where you replace <username> (including the < and > symbols) with your GitHub username.
After accepting, clone the repository to Nuvolos. You will find that the repository already contain a few files but everything else is yours to create (more on the existing files in the next steps). If you need a refresher on git clone, check the 4️⃣ Git & GitHub Guide.
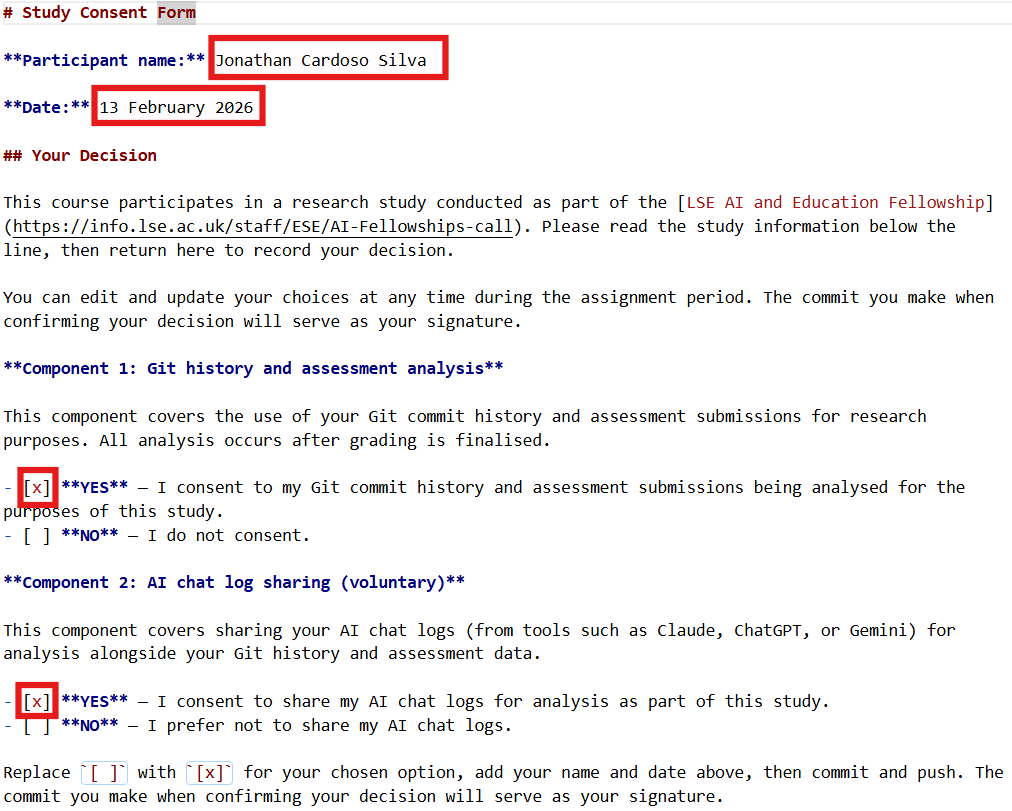
Step 3: Complete the STUDY-CONSENT.md
Your repository comes with a markdown file called STUDY-CONSENT.md. This is a form for agreeing (or not) to participate in a research study about AI in education first mentioned in 🖥️ W01 Lecture (slide 24).
Let’s use this file as a way to reinforce the Git concepts you have been learning in the course so far.
Other than agreeing to it or not, you don’t need to do anything else to participate in the study. All we need from you is your consent to use your Git logs and AI chat logs for research purposes. YOUR PARTICIPATION OR NOT HAS NO INFLUENCE ON YOUR GRADE. In fact, we will only analyse your data after the end of the Winter Term.
What to do: Open it in VS Code, read the “About the Study” section, fill in your name and date, and replace [ ] with [x] next to your chosen option for each component. We truly appreciate your participation in the study, even if you don’t use AI at all! But of course, both YES and NO are valid choices.
🧐 How to fill out the STUDY-CONSENT.md file
Using this as a Git warm-up, once you’ve filled in the form:
git add STUDY-CONSENT.md
git commit -m "Record study consent decision"
git push
If you struggled with Git in 📝 W04 Practice, this is a good chance to practise the add → commit → push sequence on a simple file like this one. You can update your decision any time before the end of term.
Figuring Things Out
The next first thing to do is to read the instructions in the NB01-Data-Collection.ipynb notebook, getting access to the new data source and familiarising yourself with how the data is structured in this new API.
🧠 Part of the assignment is learning to figure out unfamiliar tools
In computer programming, you will constantly encounter libraries and tools that are new to you. Reading unfamiliar documentation and working out what to do is a skill you are training for in this course. Your NB01 template, for example, has enough context to get you started, and the python-dotenv documentation although a bit too technical, should be straightforward to follow.
If all of this still feels mysterious after giving it a go, don’t worry. We will cover this properly in 🖥️ W05 Lecture, which falls within the teaching period before your deadline. If you get stuck at any point: ask in the #help channel on Slack.
Similarly, date manipulation in pandas (extracting the day of the week from a date, for example) will be taught in 🖥️ W05 Lecture. You can collect your data now and apply those techniques after the lecture.
Once again, if you get stuck at any point: ask in the #help channel on Slack. That’s what it’s there for!
Technical Requirements
Packages you should use:
requests,os,jsonfor API interactionpython-dotenvfor API key management (🆕 seeNB01instructions)datetime,numpy,pandasfor data manipulation- (optional)
seabornandmatplotlibfor visualisation (we will touch on them in the 🖥️ W05 Lecture but a more formal introduction to dataviz comes after Reading Week)
Vectorisation requirement:
Use vectorised operations throughout your data manipulation (NB02) and analysis (NB03). If you feel you must use a for loop, you must document why NumPy/Pandas alternatives wouldn’t work for your specific need.
Freedom to use Python packages:
You may choose to use advanced features from any pandas/numpy/seaborn packages that were not covered in lectures or in the course, as long as you document:
- How you learned about it (documentation, search engine, AI chatbot)
- How you tested it to verify understanding before using it
- Why is it that what we showed you in the course so far was not enough for your specific need? (it’s rare)
📂 File Structure and Contents
You must update the STUDY-CONSENT.md file, create three notebooks, and update the README.md file. When it comes to data, any JSON or CSV files must be saved to the data/ folder inside your repository and if you produce any figures, you can save them to a figures/ folder inside your repository.
Each notebook should also include your candidate number in the header. This is the 5-digit number LSE assigns you every year, available on LSE for You. If you’re unsure where to find it, ask on #help.
In terms of file structure, your repository should look like this:
<github-repo-folder>/
|-- data/
|   |-- ... several data files here ...
|-- figures/
|   |-- ... several figure files here if you produce any ...
|-- notebooks/
|   |-- NB01 - Data Collection.ipynb
|   |-- NB02 - Data Transformation.ipynb
|   |-- NB03 - Data Analysis.ipynb
|-- README.md
|-- STUDY-CONSENT.md
📥 NB01-Data-Collection.ipynb
Partial template provided. You complete the rest.
- API authentication working
- Historical data collected
- JSON file saved to
data/folder
🔄 NB02-Data-Transformation.ipynb
No template provided. You determine structure.
- JSON loaded and parsed
- Pandas transformations applied
- Day-of-week tagging and temporal processing
- CSV file(s) saved to
data/folder
📊 NB03-Data-Analysis.ipynb
No template provided. You determine structure.
- CSV loaded
- Vectorised analysis performed
- Two insights produced, each addressing a different aspect of the weekend question:
- 2 styled DataFrames OR
- 1 styled DataFrame + 1 seaborn visualisation OR
- 2 seaborn visualisations
- Each insight must have a narrative title (states finding directly, not description)
📄 README.md
Template provided. You replace the placeholder sections.
- Project overview and research question
- Key decisions (time period, location, pollutants)
- Reproduction instructions (packages, API keys)
- Data sources with citations
- Summary of findings
Whilst we will not dictate how you are to structure your notebooks, you will be graded on the hierarchical organisation of your notebooks. Use clear markdown headers, logical section progression, and appropriate code/markdown cell balance.
Reflection & Process Documentation
Add 💭 **Personal Reflection Notes:** cells as you work, briefly explaining technical decisions, reasons for using particular functions (including anything new), how you tested them, any issues or re-runs, and what you tried to resolve challenges.
Your reflection notes should be substantive but concise. Each reflection cell should address the specific decision/process at hand without excessive repetition. Think: “What would a colleague need to know to understand my choice?” rather than “How can I fill space?”.
Need guidance on effective reflection? Review the 🖥️ W04 Lecture recording as we touched on how detailed your reflections should be.
📅 Recommended Work Pattern
This assignment is designed to support your learning across two weeks:
From now until W05 Thursday: Work on NB01-Data-Collection.ipynb. Get your API authentication working and collect historical data. Ideally, also start NB02-Data-Transformation.ipynb using what you know about for loops to get a working version of your data pipeline.
W05 Thursday Lecture: You’ll learn other vectorised operations like .apply(), .groupby(), and datetime operations (like extracting the day of the week from a date column) that will help you complete your data transformations and analysis. If you started NB02 with loops, you’ll see how to translate those to vectorised operations. Reserve time after the lecture to rewrite/complete your NB02-Data-Transformation.ipynb, this time using only vectorised operations.
W05 Friday Lab: You’ll learn seaborn visualisation techniques that you’ll use for your insights in NB03.
After W05 Lab until W06 (Reading Week): Complete NB02 and NB03, incorporating what you learned in W05. Attend drop-in sessions (Reading Week) if you get stuck.
💡 TIP: If you follow this recommended work pattern, coming to W05 Lecture with data already collected (and ideally a loop-based draft of NB02) means you’ll immediately see how new techniques apply to your actual project.
✔️ How We Will Grade Your Work
I don’t enjoy this but, unfortunately, I must be strict when grading summative assignments to mitigate fears over grade inflation.
Higher marks are reserved for those who demonstrate exceptional talent or effort, but in a way that aligns with the learning objectives and coding philosophy of this course. (Simply adding more analysis or complicating the code is not sufficient!)
Critical reminder: You are graded on reasoning process and decision documentation, not just functional code. Correct output with weak justification scores lower than incorrect output with clear evidence of learning.
Coherence matters: We assess whether what you write in your reflections matches what you actually did in your code. If you use sophisticated techniques but can’t explain why you chose them or how they relate to what we taught in lectures and labs, this suggests the work isn’t genuinely yours. We want to see you connect your decisions to specific course activities (e.g., “I used vectorised operations as shown in W04 Lab Section 3” rather than generic statements like “I used pandas because it’s efficient”).
The good news is that, if you have been attentive to the teaching materials and actively engaged with the exercises, it should still be feasible to achieve a ‘Very Good!’ level (70-75 marks).
Here is a rough rubric of how we will grade your work.
🧐 Documentation & Reflection (0-30 marks)
Covers all three notebooks and the README.md file
| Marks awarded | Level | Description |
|---|---|---|
| <12 marks |
Poor | Key documentation is missing or has too many critical problems. For example: README missing or mostly empty, notebooks have almost no markdown explaining what you did, no reflections about your decisions, or we simply can’t understand what you did or why you did it. |
| 12-14 marks |
Weak | You submitted the work but it has multiple serious problems. For example: documentation is very limited or poorly organised, reflections are extremely generic or superficial with no real explanation of your choices, or multiple key elements are missing or severely incomplete. |
| 15-17 marks |
Fair | Adequate work with notable weaknesses. Deliverables present but reflections are generic, decision justifications are limited, work is disorganised, or lacks connection to course content. |
| 18-20 marks |
Good | Competent documentation with reasonable reflection. README and notebooks organised with some specific reasoning and decision documentation. Reflections show some connection to course materials though may be limited. |
| 21-23 marks |
Very Good! | Solid documentation with substantive reflection showing clear course alignment. Typical of someone who has done all prior practice exercises and attended all lectures/classes and actively participated in the course. Clear README and well-organised notebooks with specific reasoning, documented decision-making process, credible sources cited, and reflections that reference specific course activities (lectures, labs, practice exercises). What you write matches what you did. |
| 24+ marks |
🏆 WOW | Exceptional reflection quality with sophisticated understanding. Publishable-quality documentation with evidence of deep research, comparative reasoning, and genuine analytical thinking throughout. |
📥 Data Collection & Transformation (0-30 marks)
Covers NB01-Data-Collection.ipynb and NB02-Data-Transformation.ipynb
| Marks awarded | Level | Description |
|---|---|---|
| <12 marks |
Poor | Your code logic doesn’t work (even if it runs OK). For example: authentication failed, you used the wrong API endpoint so you didn’t get historical data, files are missing, or your code has so many errors it can’t run. |
| 12-14 marks |
Weak | Your code runs but has multiple serious problems. For example: you collected data that doesn’t actually help answer the question, you used lots of for loops when vectorisation would work, your files are disorganised or mixed together, or your code is very messy and hard to follow. |
| 15-17 marks |
Fair | Your workflow works but has notable problems. API authentication and data collection function but with concerning issues in how you implemented things, how you organised your code, or disconnection between the sophistication of your code and what we taught (using advanced techniques without explaining why they’re better than what we showed you). |
| 18-20 marks |
Good | Competent technical work. API authentication and data collection working with reasonable use of the techniques we taught (vectorised operations, proper file organisation). If you used techniques beyond the course, you show some understanding of why they were appropriate or better than what we showed you. |
| 21-23 marks |
Very Good! | Clean, appropriate technical work clearly aligned with what we taught. Typical of someone who has done all prior practice exercises and attended all lectures/classes. API authentication working, data collected successfully, proper use of vectorised operations, files organised correctly, code is clean. If you used advanced techniques we haven’t covered, you clearly explain why they were more appropriate than the simpler approaches we taught. |
| 24+ marks |
🏆 WOW | Exceptional technical implementation. Exceptionally clean pandas transformations, creative method chaining, professional touches like exceptionally clean and clearly named custom functions or error handling, exemplary organisation. |
📊 Data Analysis & Insights (0-40 marks)
Covers NB03-Data-Analysis.ipynb and the README.md file
| Marks awarded | Level | Description |
|---|---|---|
| <16 marks |
Poor | Your analysis doesn’t answer the question or has too many fundamental problems. For example: no insights produced (no visualisations and no styled DataFrames), your code has too many errors to interpret, axes are unlabelled or misleading, or your interpretation is completely wrong or missing. |
| 16-19 marks |
Weak | You tried to do analysis but it doesn’t work well. For example: your visualisations don’t actually show what you’re trying to say, your titles just describe what’s in the chart rather than stating a finding, your charts are poorly formatted (missing labels, messy legends), your interpretation is very shallow, or you barely used vectorisation when you should have. |
| 20-23 marks |
Fair | Your analysis produces some insights but has notable problems. You’ve done analytical work but there are significant weaknesses in how you communicated findings, how you implemented the analysis, or disconnection between the sophistication of your techniques and what we taught (using advanced methods without explaining why they’re better than what we showed you). |
| 24-27 marks |
Good | Competent analysis with reasonable insights. Two insights produced with acceptable visualisations, reasonable interpretation, and use of the techniques we taught (vectorised operations, appropriate plot types). If you used analytical methods beyond the course, you show some understanding of why. |
| 28-31 marks |
Very Good! | Solid analysis with clear insights, clearly aligned with what we taught. Typical of someone who has done all prior practice exercises and attended all lectures/classes. Two clear insights with narrative titles, properly labelled visualisations, appropriate choices, accurate interpretation, vectorised operations, clean code. If you used advanced analytical techniques we haven’t covered, you clearly explain why they were more appropriate than the simpler methods we taught. |
| 32+ marks |
🏆 WOW | Exceptional analysis with compelling narrative. Publication-quality visualisations, sophisticated seaborn styling, professional pandas technique, nuanced pattern discovery, convincing narrative. |
🔗 Useful Resources
📊 Essential Guides
- 3️⃣ Data Science Workflow: Complete workflow stages
- 4️⃣ Git & GitHub Guide: Version control reference
💻 Course Materials
- 🖥️ W04 Lecture: Vectorisation concepts and reflection importance
- 💻 W04 Lab: NumPy and Pandas practice
- 📝 W04 Practice: Complete workflow example
🆘 Getting Help
- Slack: Post questions to
#helpchannel - Office Hours: Book via StudentHub
- Custom AI: DS105W Claude Project
Check staff availability on the ✋ Contact Hours page.
🌐 External Resources
- OpenWeather API Documentation: Air pollution data access
- UK DEFRA Air Quality: Official UK standards
- WHO Air Quality Guidelines: International thresholds
- python-dotenv Documentation: API key management
Footnotes
A secret source, who asked to remain anonymous, told us that OQI are not that interested in the actual answer, but rather the process you took to answer it.↩︎