Week 01
From Data to Insight: The Importance of Clean Data
DS105A – Data for Data Science
🗓️ 08 Jul 2026
Meet the DS105A Team!

Course Lead

Dr Jon Cardoso-Silva 📧 ![]() @jonjoncardoso
@jonjoncardoso
Assistant Professor (Education)
LSE Data Science Institute
Course Leader
![]()
![]()
Expertise & Current Projects
- PhD in Computer Science
- Experienced in software engineering, data science and data engineering
- Investigating the impact of GenAI impact on higher education (
![]() GENIAL project*)
GENIAL project*)
🏆 Winner of LSESU Teaching Award for Feedback & Communication (2023)
Office Hours:
(Typically) Wednesdays 14:00-16:00
Book via StudentHub
* Read more about the ![]() GENIAL project here.
GENIAL project here.
Teaching Support


Riya Chhikara
Tabtim Duenger
Pedro Henrique
Class Teacher
Class Teacher
Class Teacher
Teaches: CG3 & CG4
Teaches: CG1, CG2 & CG8
Teaches: CG5, CG6 & CG7
Role outside DSI:
Data Scientist at
The Economist
Role outside DSI:
Data Scientist at
The Economist
Role outside DSI:
PhD Candidate in Computer Science at King’s College London
![]()
![]()
![]()
Administrative Support

Kevin Kittoe
Teaching & Assessment Administrator (DSI)
Admin
Contact 📧 DSI.ug@lse.ac.uk for:
- Course access issues
- Assignment submissions
- Extension requests
- Administrative queries
Key Information:
- All extension requests must follow LSE’s extension policy
- Email response time: 24-48 hours
- Include ‘[DS105A]’ in email subject lines
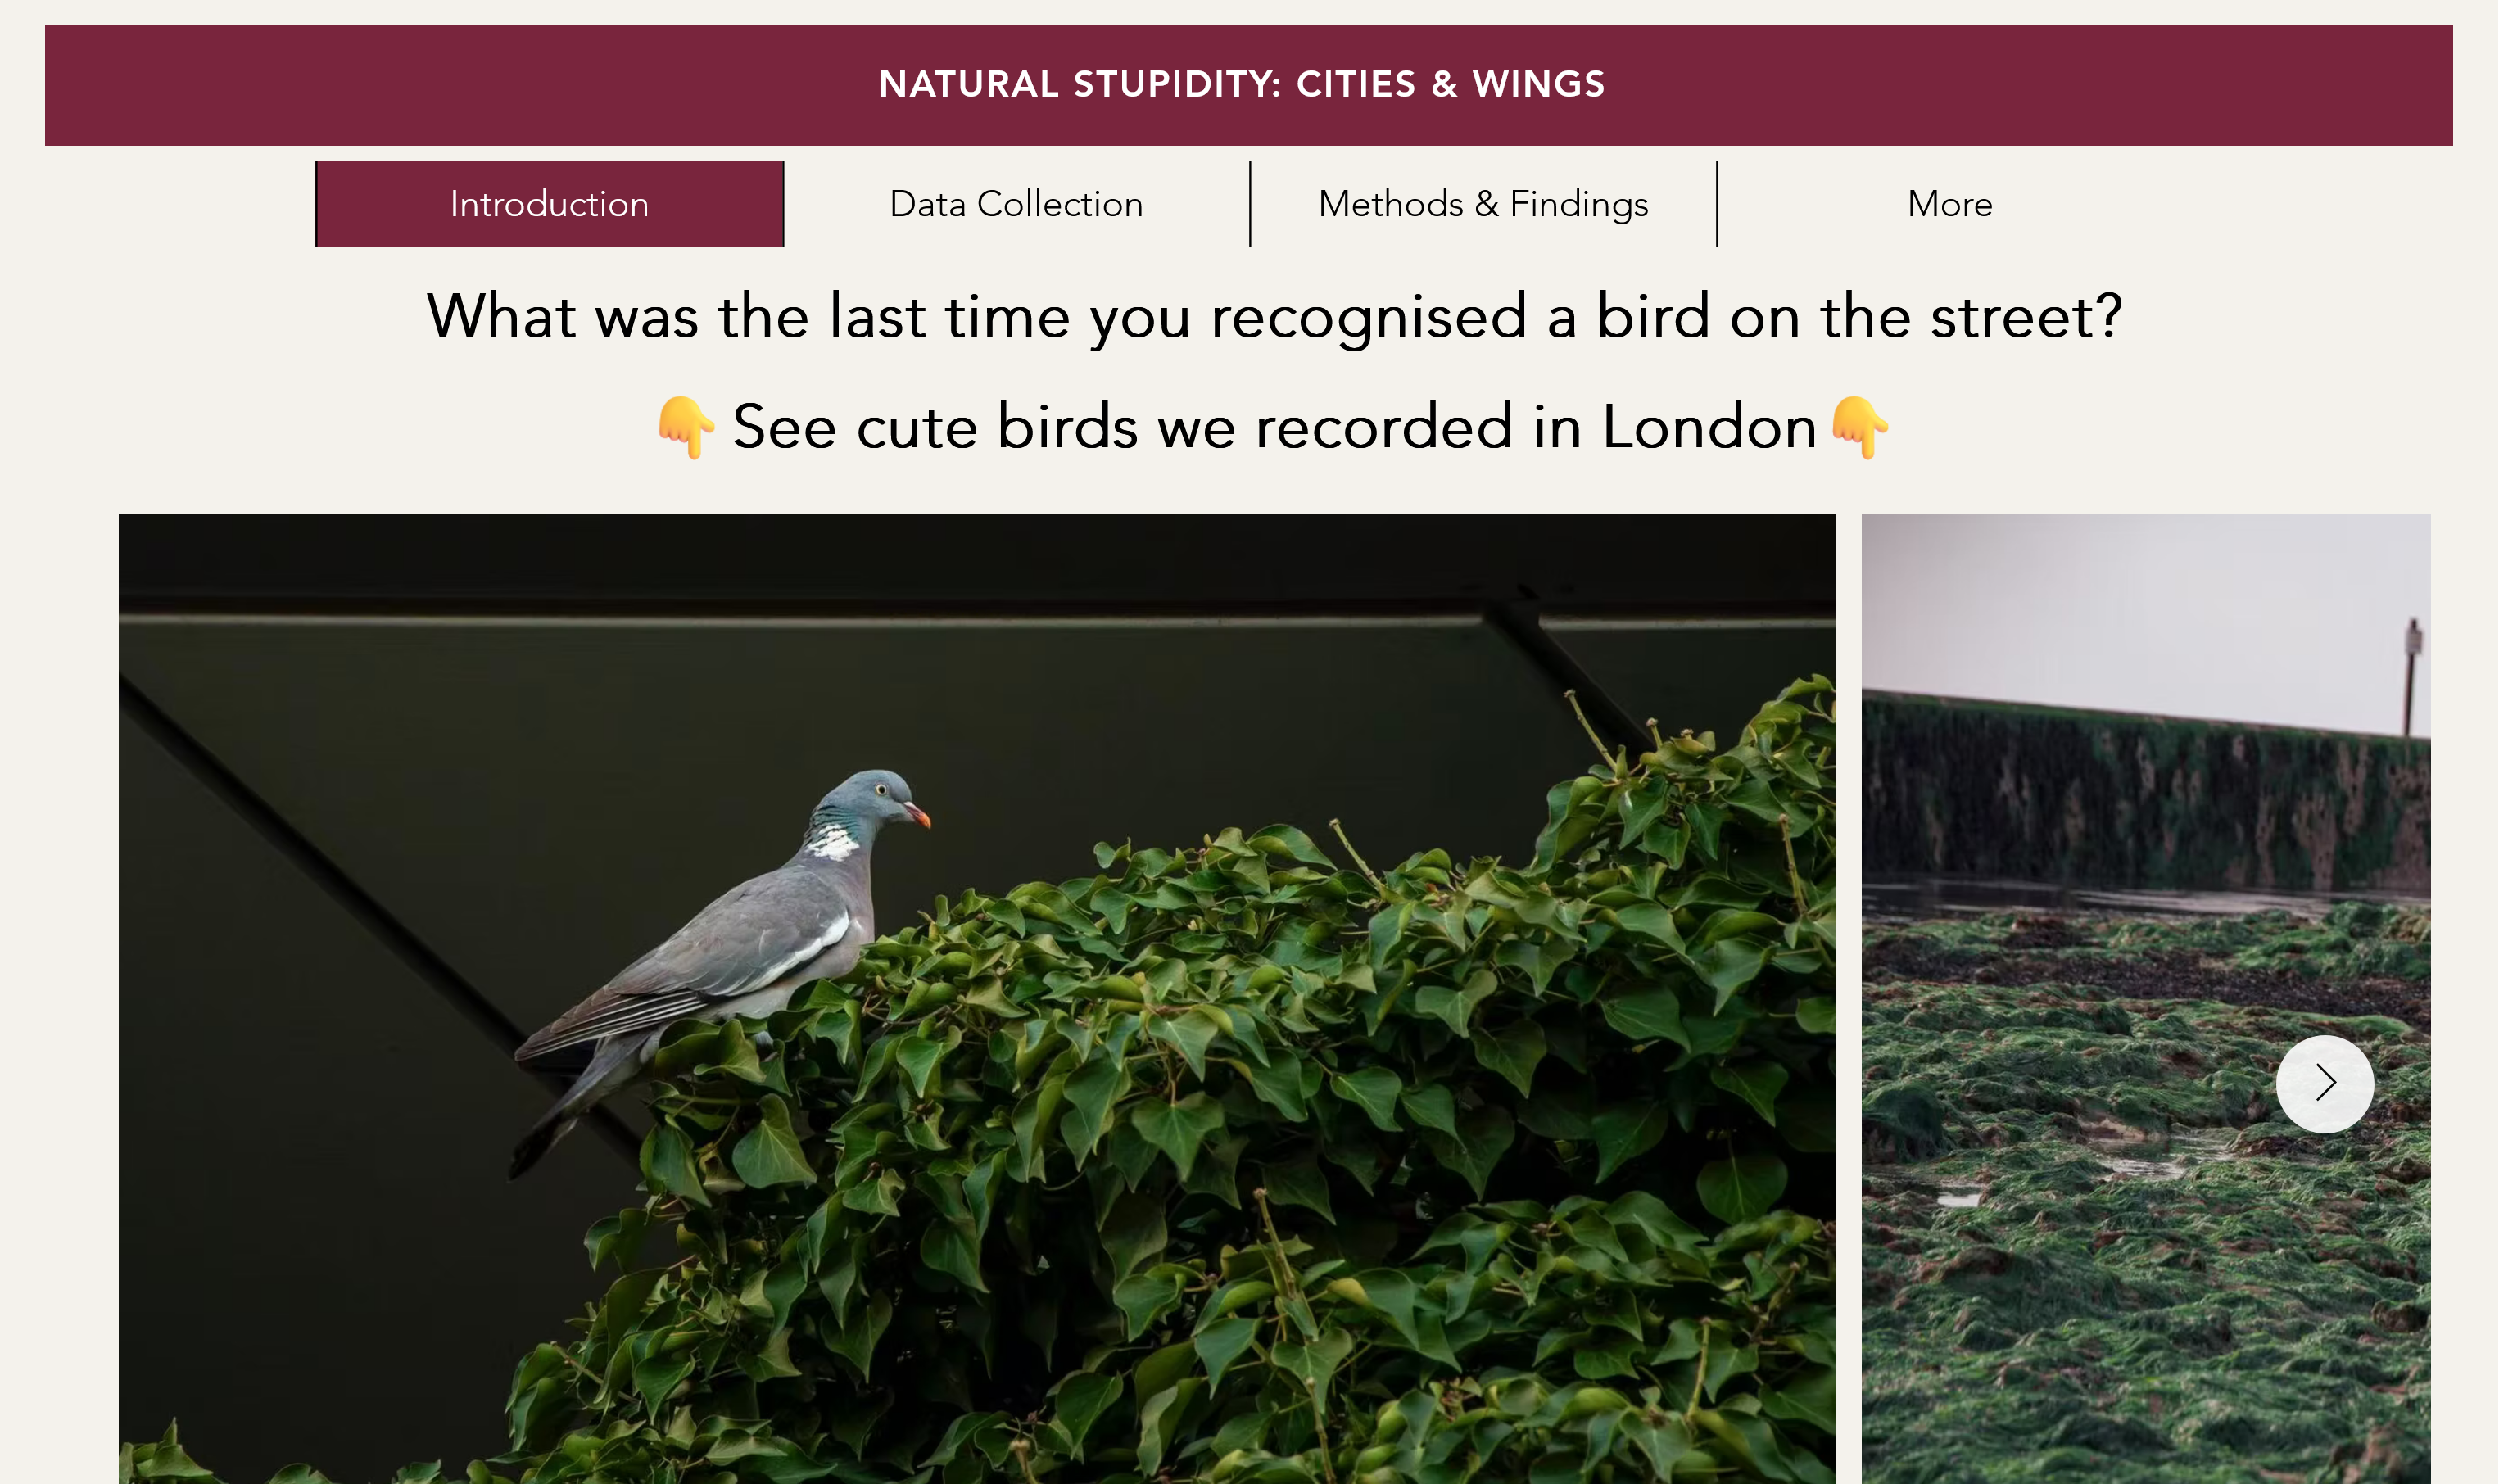
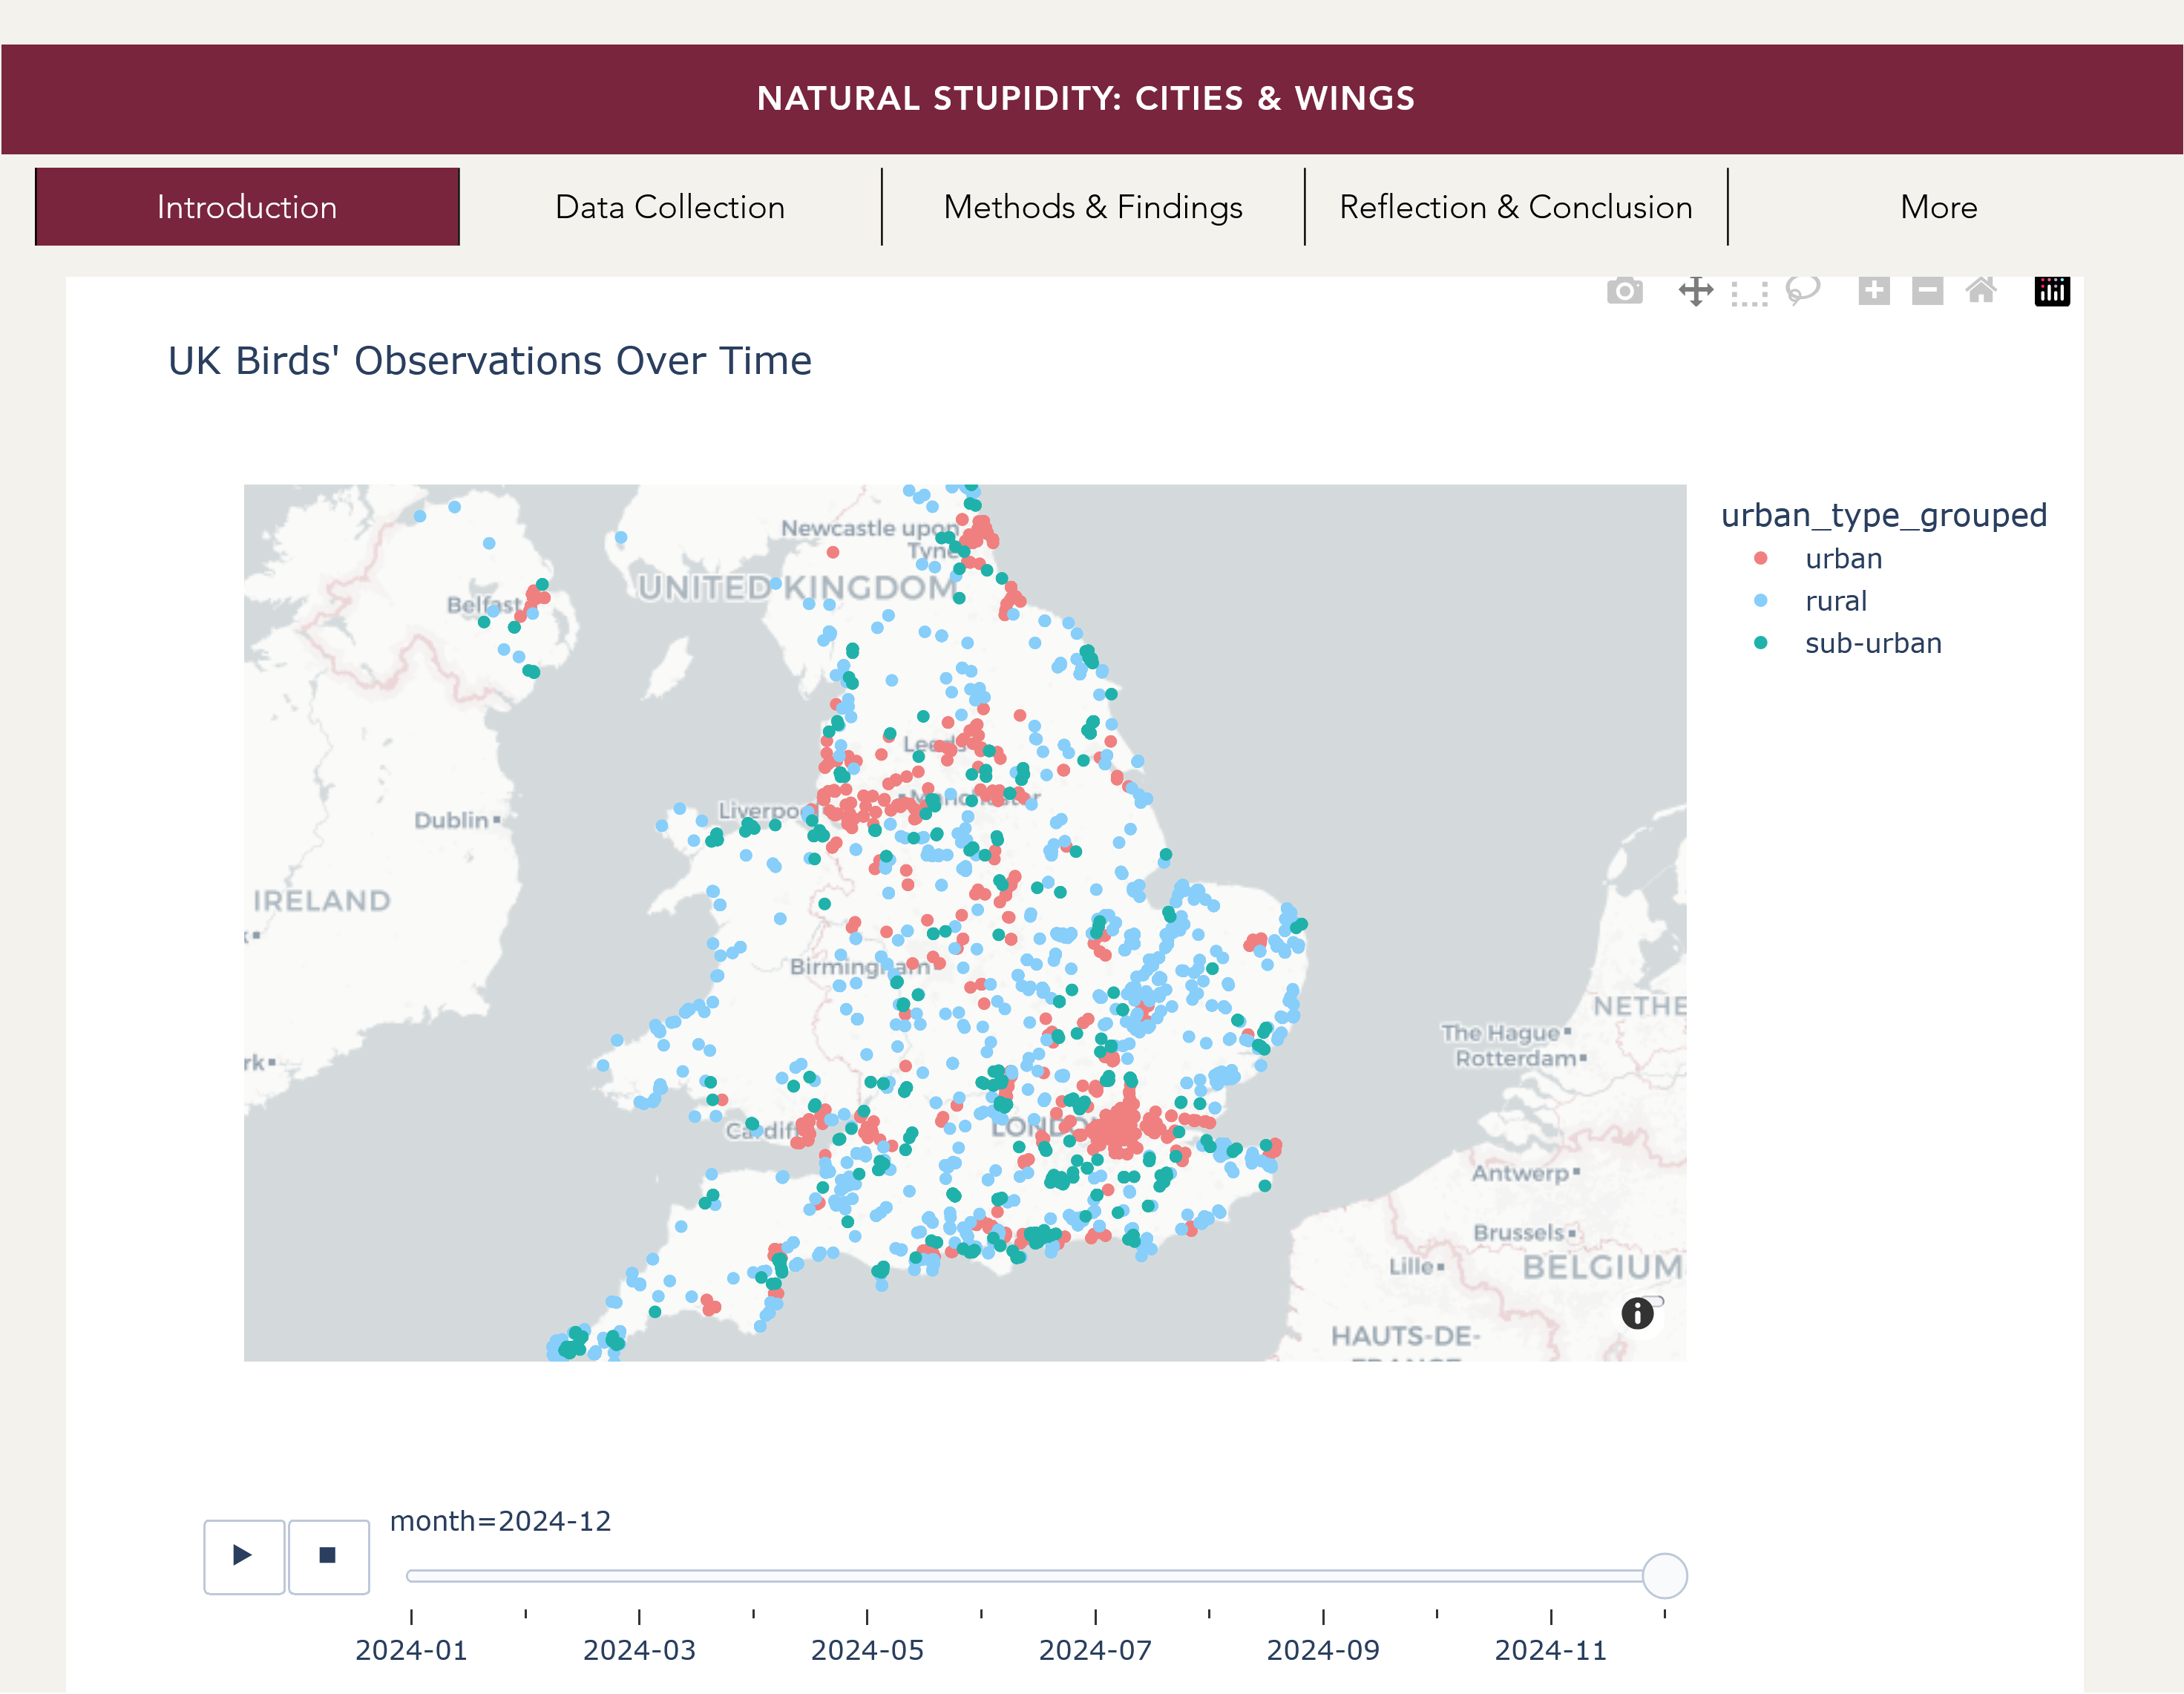
Bird Migration Project
Project from the 🌐 ‘Natural Stupidity’ group submitted in the 2024/25 Winter Term iteration of DS105.
Using data from 🐦 eBird amongst other sources, the group traced the prevalence of species migrating through the UK.
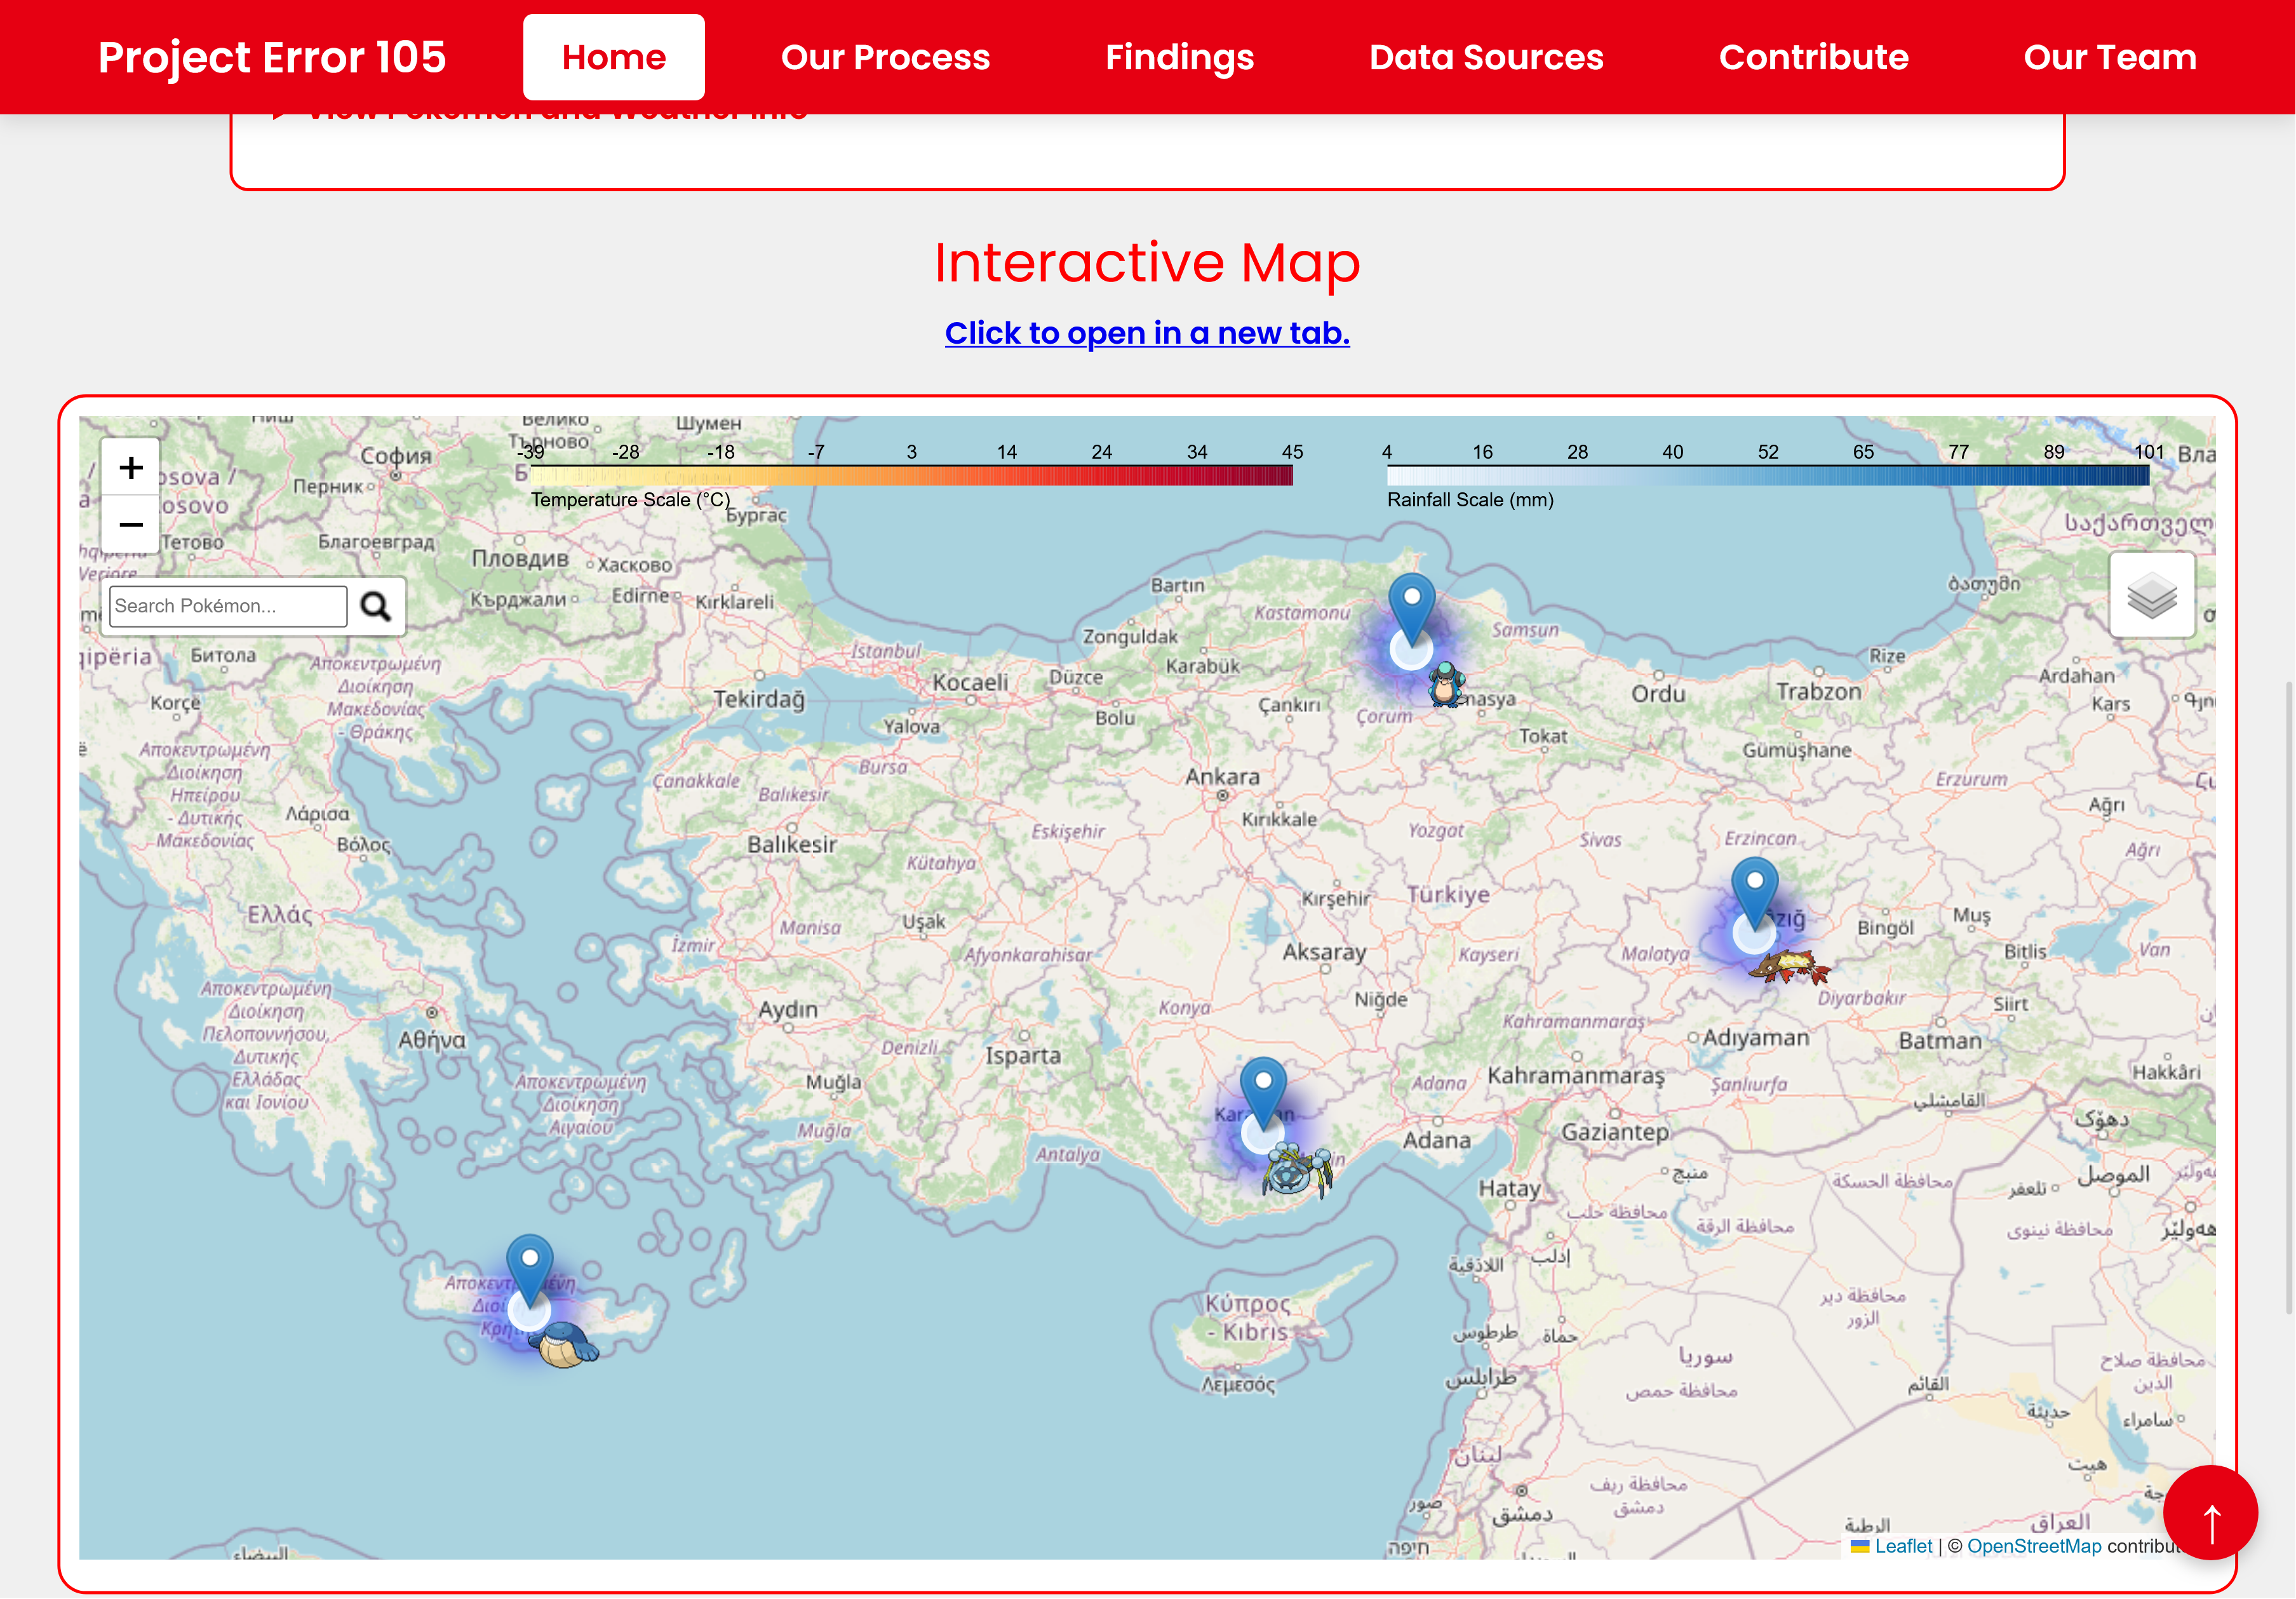
Pokemon Project
This team decided to answer this silly question: “If Pokemon were real, where would they live on Earth?”
See 🌐 their final website for more details.
How will you get there?
The DS105 way is to practise every week until you master the data science workflow below.

I will come back to this diagramlater.
📑 Key Information
📟 Communication & Support
![]() Slack is our main point of contact. The invitation link will be available on Moodle.
Slack is our main point of contact. The invitation link will be available on Moodle.- 📧 Email: Reserved for formal requests (extensions, appeals)
- 📅 Office Hours: Book via StudentHub
- 🆘 Drop-in Support: COL.1.06 (DSI Studio) - Check current schedule
No Software Installation Required
All coding happens in the browser via ![]() Nuvolos Cloud with VS Code and Jupyter pre-configured.
Nuvolos Cloud with VS Code and Jupyter pre-configured.
Visit Nuvolos - First Time Access to get started.
Weekly schedule, assessment deadlines, and complete learning progression.
🧘 Quick Break
Let’s take 10 minutes to stretch our legs, drink some water and come back refreshed.
When we return:
- What is the data science workflow?
- How should you think when doing an analysis?
- Generative AI: help or hindrance?

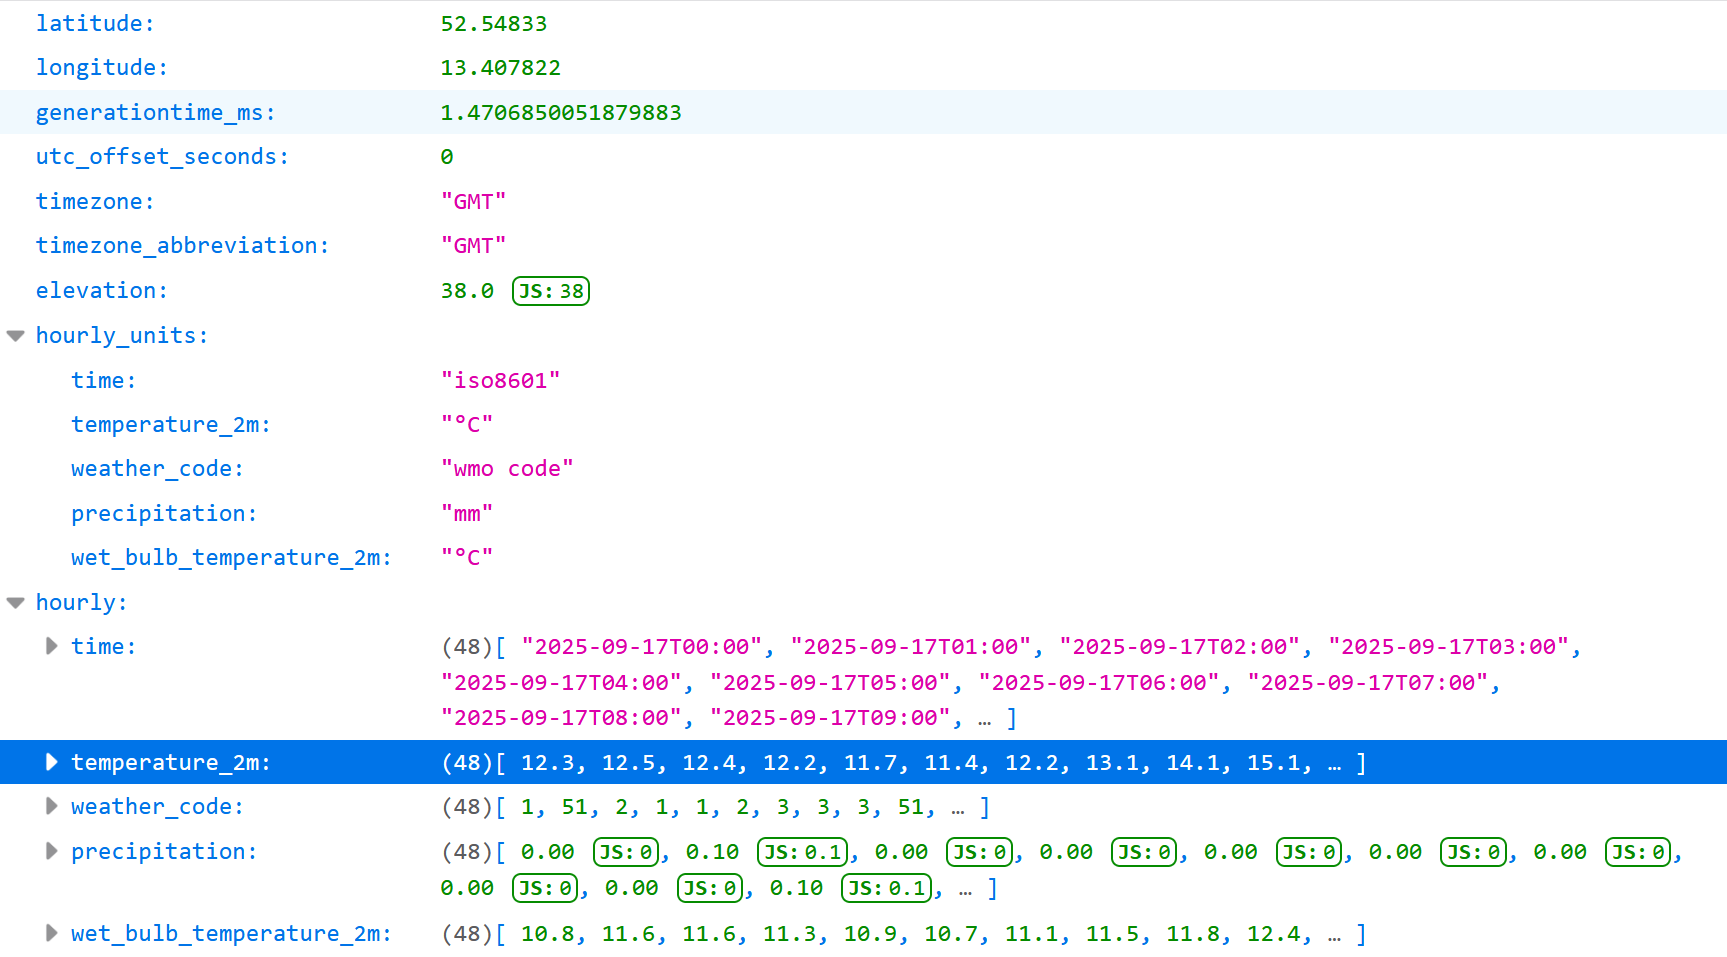
Illustration of the typical steps involved
What raw data looks like
You will then learn that you have to impose a structure on this data to make working with it more manageable.
The course policy on AI
You can use AI chatbots like ChatGPT, Claude and Gemini freely in this course, including in assignments. There are no restrictions and we can even give feedback on your use of AI for learning.
Be IN CONTROL when using AI
⚠️ However, I do have a few warnings about this. Some are grounded on research I have been doing in this topic as part of the ![]() GENIAL project* and some are based on my personal experience.
GENIAL project* and some are based on my personal experience.
- GenAI is really powerful and cool but it’s only really useful (for learning) if you have the skills to judge its output.
- I guarantee you: you can get ‘brain rot’ if you let AI do all the work for you.
- When marking your work, we will give more weight to whatever we can see as evidence of your human judgement and personal learning growth. We value seeing your thinking process and critical judgement more than looking at an impressive-looking chart or table.
* Read more about the ![]() GENIAL project here.
GENIAL project here.
Our custom Claude
This is why I set up a custom Claude for our course.
It’s a way to try to ensure you are using an AI that is more aligned with things we do in the course as opposed to generic (and boring) things you would find on the Internet.
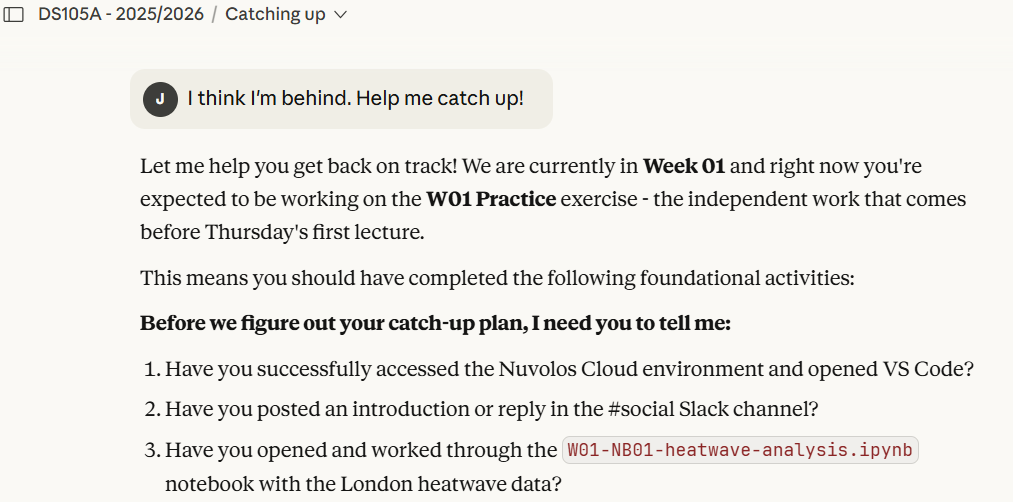
Tip: you can ask the DS105A Claude to give you a catch-up plan if you are behind.
🔖 Quick Links & Next Steps
📚 Resources
![]() Slack workspace (link on Moodle)
Slack workspace (link on Moodle)![]() Nuvolos - First Time
Nuvolos - First Time- 📝 W01 Practice
- 3️⃣ Data Science Workflow
- 📔 Full Syllabus
💻 W01 Lab
Tomorrow’s lab session focuses on:
- Let’s take one step back in the data science workflow
- Working with daily temperature data
- Describe your thinking process
🗓️ Next Week
Week 02 focuses on:
- Python fundamentals (variables, data types, lists, dictionaries)
- Collecting real data in Python
📝 W02 Practice Exercise will be released tomorrow afternoon.