🗓️ Week 01 | Day 01
Foundations of Data Wrangling with Python
ME204 – Data Engineering for the Social World

Dr Jon Cardoso-Silva
Assistant Professor (Education)
14 July 2025
Your lecturer
Dr Jon Cardoso-Silva
🌐 jonjoncardoso.github.io
📧 J.Cardoso-Silva@lse.ac.uk
Assistant Professor (Education)
![]()
Background:
- PhD in Computer Science (King’s College London)
- Industry experience in:
- software development (Java, Python, R, SQL, etc.)
- as a lead data scientist (big projects, team management, etc.)
Highlighted research:
![]()
GENIAL: Generative AI in Education
- How are generative AI tools (like ChatGPT, Gemini, Claude, etc.) changing the way we learn and code?
- Building evidence and practical guidance for using GenAI in data science education.
📢 I will talk more about our findings shortly when I talk about the AI policy for this course!
Learn more about the ![]() GENIAL project
GENIAL project
Who we are: your class teacher

Dr Stuart Bramwell
Guest Teacher
📧 s.bramwell@lse.ac.uk ![]()
- Has been teaching at the LSE Data Science Institute for the past couple of years.
- Teaches on DS105 (Jon’s regular course that inspires ME204).
- Also teaches in our machine learning course (DS202) and the introductory course to data science (DS101).
- Research background: Political scientist (DPhil, Oxford). Co-creator of the WhoGov dataset, which won the Lijphart/Przeworski/Verba data set award. Researches political elites, social identity (gender, class, ethnicity), and democratisation. Read more
The Data Science Institute

- This course is offered by the LSE Data Science Institute (DSI).
- DSI is the hub for LSE’s interdisciplinary collaboration in data science
- 👉 Sign up to the DSI newsletter. Even when you go back home, you can keep up with the latest news and events from the DSI.
Who are you? 🫵 10:20 – 10:50
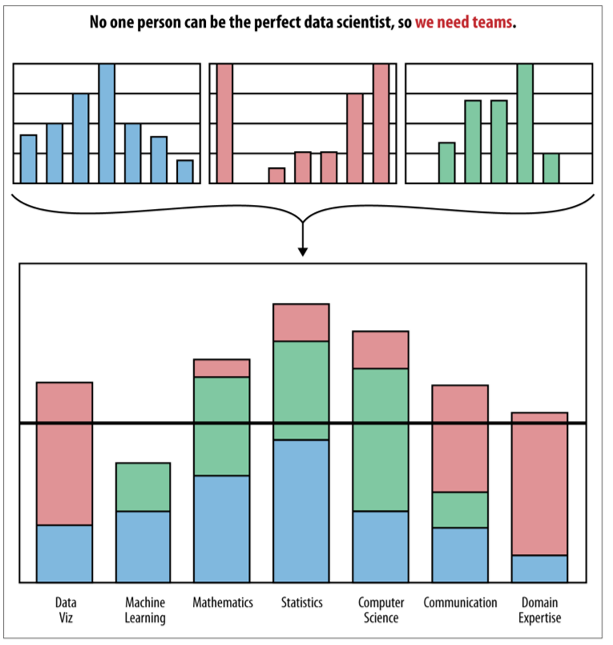
It’s fake that data scientists are these mythical unicorns 🦄

knows everything about statistics
able to communicate insights perfectly
fully understands businesses like no one
is a fluent computer programmer
In reality…
We are all jugglers 🤹
- Everyone brings a different skill set.
- We need multi-disciplinary teams.
- Good data scientists know a bit of everything.
- Not fluent in all things
- Understands their strenghts and weaknessess
- They know when and where to interface with others
The Data Science Workflow

The Data Science Workflow (of this course)

People in the field like to joke that 80% of the time and effort spent on a data science project goes to the tasks highlighted in the diagram above.
And this is what this course is about! You will learn some of the most common tools used during this data wrangling process.
The meme is real:
The struggle is real.
by u/ali_azg in r/dataengineering
Preparing data for analysis doesn’t get as much attention as algorithms (what people usually think of when they hear the term data science), but it’s an ESSENTIAL skill if you want to work with data.
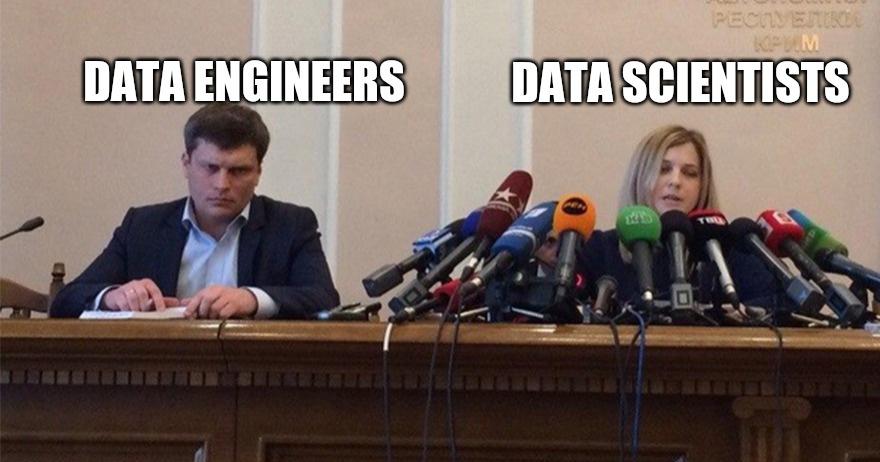
A few words on Data Engineering
In industry, data engineers are the ones who are responsible for the data pipeline.
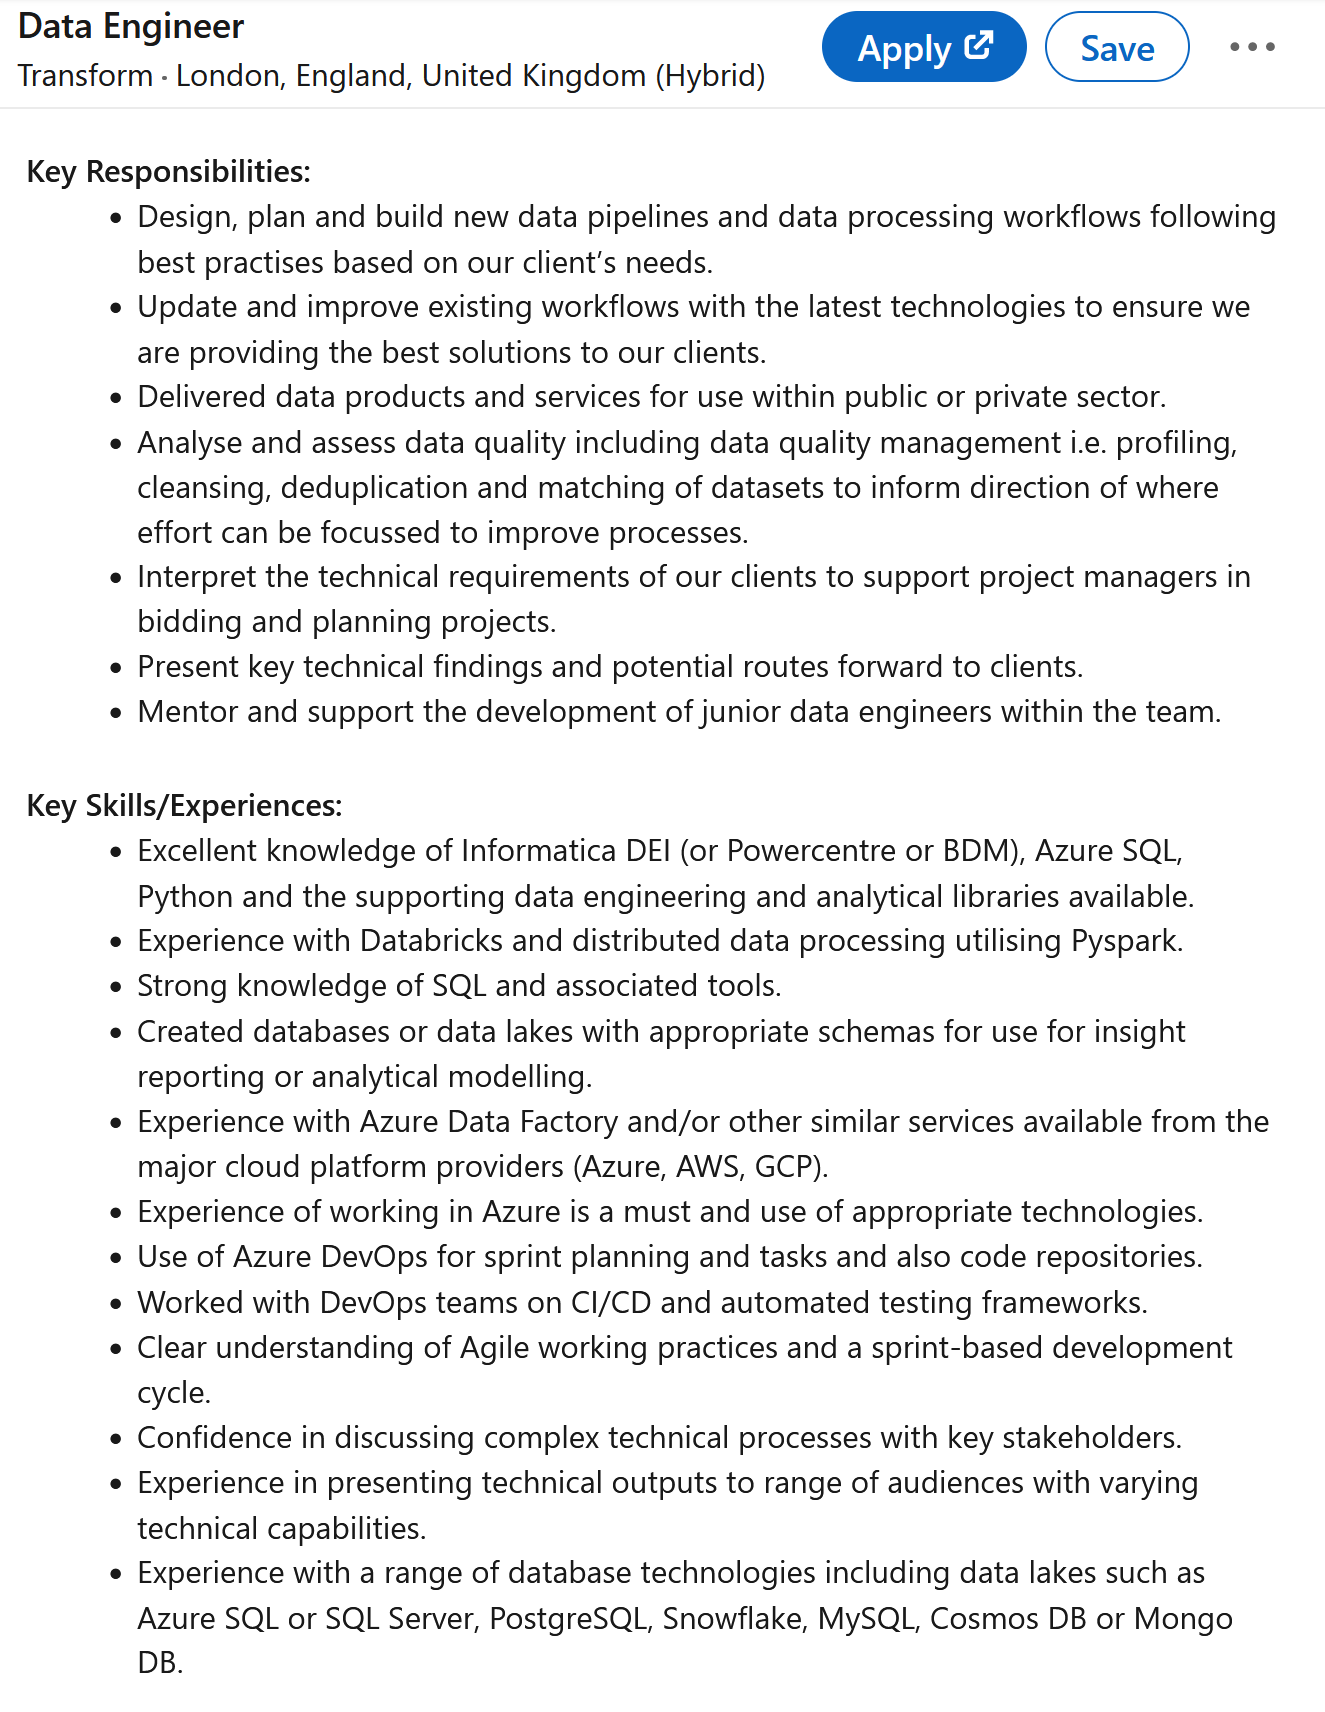
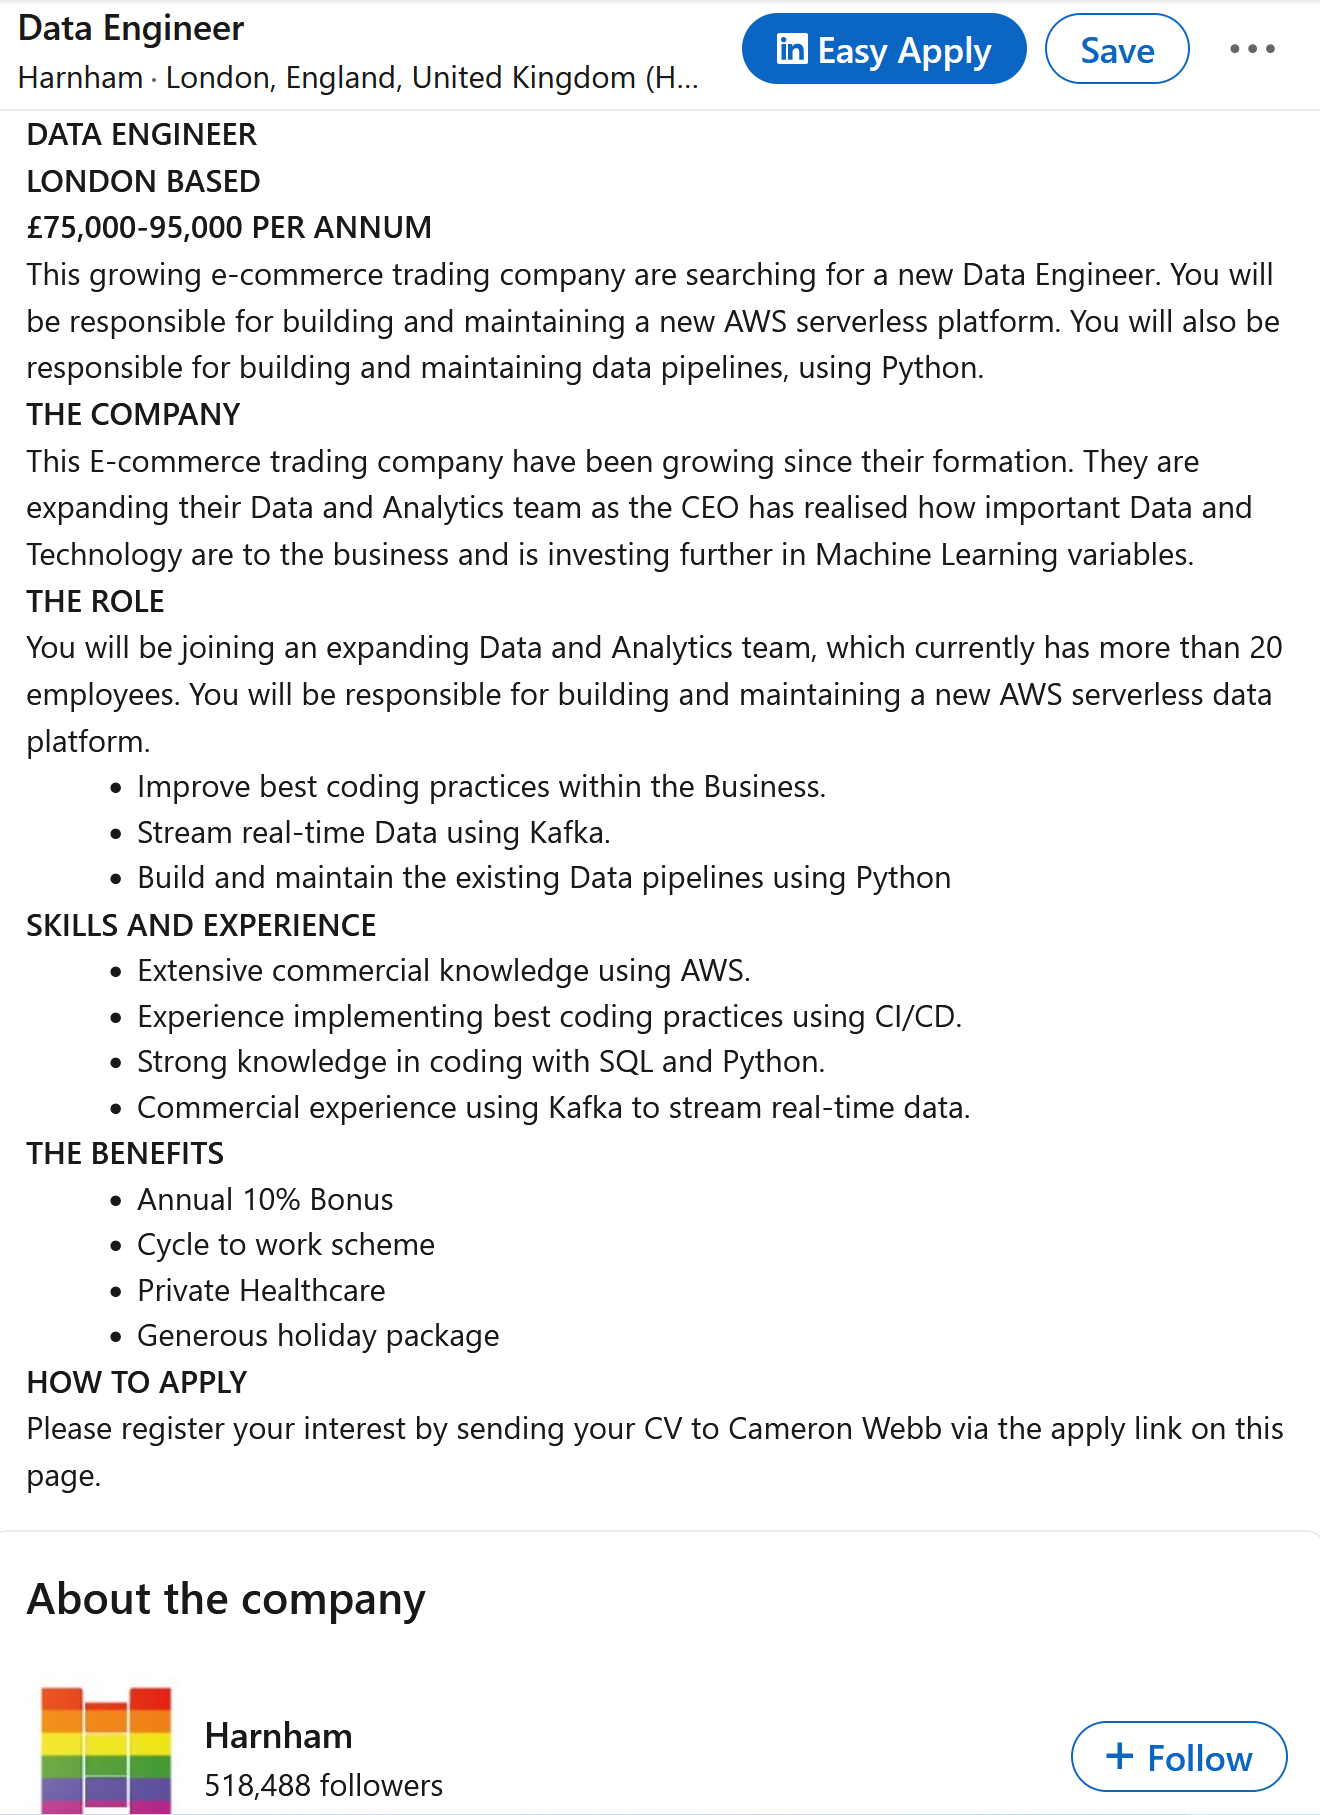
Data Engineer jobs - Part II
Course syllabus

.svg this year) inspired by it using a procedural art script in Python.Let’s look at the course syllabus:
📔 Syllabus on ![]() Moodle.
Moodle.
By the way, everything you need is on Moodle but we also have a public-facing website, so you can refer to it even after the course is over:
Our expectations of you

- Let us know when you think we have been unclear when teaching a particular topic
- You have a good sense of self-direction:
- If you feel behind others: you are not afraid of asking questions
- If you are ahead of others: help those around you to reach the same level as you
- Your use of 🤖 GenAI tools is productive and not a substitute for your own learning.
Our expectations of you, coding-wise
Important
This course is designed for students with some basic coding experience in mind.
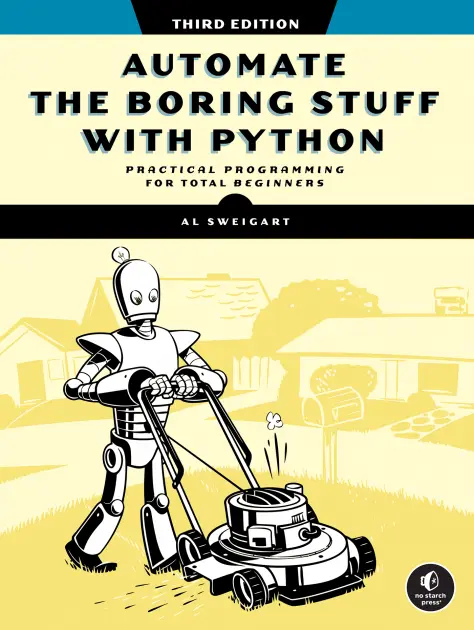
I recommended the free online book 📗 Automate the Boring Stuff as a pre-course reading.
💆♂️ HOWEVER: coding beginners have done really well in the previous ME204 iterations (and in my other regular course, DS105)! As long as you are aware that you will need to put in a bit more effort than others, you will be totally fine.
Use of Generative AI in this course
Let me go back to the Mentimeter activity 👉
🤖 LSE’s AI Policy Framework
LSE asks course leaders to adopt one of three positions on generative AI use.
For ME204, I’ve chosen Position 3: Full authorised use of generative AI in assessment which means:
- You can use any AI tools you want
- You might have access to LSE’s
![]() Claude for Education.
Claude for Education.
- You might have access to LSE’s
- You are allowed to use AI tools in your assignments, too.
- We will show productive examples of AI use in this course.
👉 You are also allowed NOT to use AI tools if you prefer.
📑 Our marking strategy:
In this course, we really favour process over output when it comes to learning.
When marking, we will always be searching for evidence of learning. It is important that you explain, at a high-level, the rationale behind your choices for all your key decisions.
Even if you produce incredibly advanced stuff, if it does not engage with the things we have been discussing in lectures and labs (because or not because of AI), you will not be likely to get a good grade.
What We Want to See
Purposeful Code:
- Concise, focused solutions
- Clear understanding of what you need
- Evidence you’ve thought through the problem
Authentic Writing:
- Your voice coming through
- Concise and purposeful explanations
- Use AI to polish ideas, not replace thinking

🍵 Coffee Break 11:30 – 11:45
Let’s take 15 minutes to get a coffee and come back refreshed.
When we return:
- What does it feel like to plan a data processing pipeline?
- Which tools will we use in this course?
- What to expect from the afternoon lab and the rest of the week?

Case Study: Boston's Gender Wage Gap

This report unites the efforts of the Boston Women’s Workforce Council to understand the wage gap in the city. It is a great model of data reporting to aspire to do in this course.


They communicate key takeaways in a simple, clear and engaging way and the text accompanying the figures tell us exactly what the author’s point is. The readers are directed to the plot for confirmation of that point.
:::
Python vs R
In case you are curious about how equivalent the two languages are, here is a comparison of the most common data science packages in each language.
![]() Python
Python

How will we share code?
Github!
Use  Github for everything related to your project!
- You will learn to setup Github for your own code on 🗓️ Week 01 Day 03 lab.
Important
Don’t share code via e-mail, Dropbox, Google Drive, or anything like that!
It is a bad practice. Things get messy very quickly.
Let’s get started with ![]() Nuvolos
Nuvolos
We have a cloud environment called Nuvolos that has been set up for you to use during these 3 weeks of ME204.
Thanks for coming! THE END
ME204 - Data Engineering for the Social World
LSE Summer School 2025 | ME204 Week 01 Day 01