Week 07
JSON Normalisation and Data Reshaping
DS105A – Data for Data Science
🗓️ 13 Nov 2025
Today’s Goals
- Learn:
pd.json_normalize()to flatten nested JSON structures
- See: Other reshaping tools (
concat(),explode(),melt()) that you’ll use again in W08 and W09
Why this matters: These skills directly support your ✍️ Mini-Project 2 work and make your MP1 code simpler.
1️⃣ Mentimeter: MP1 Experience

I will share a link to a Mentimeter poll to gather your experience with the ✍️ Mini-Project 1.
2️⃣ Lessons from ✍️ MP1
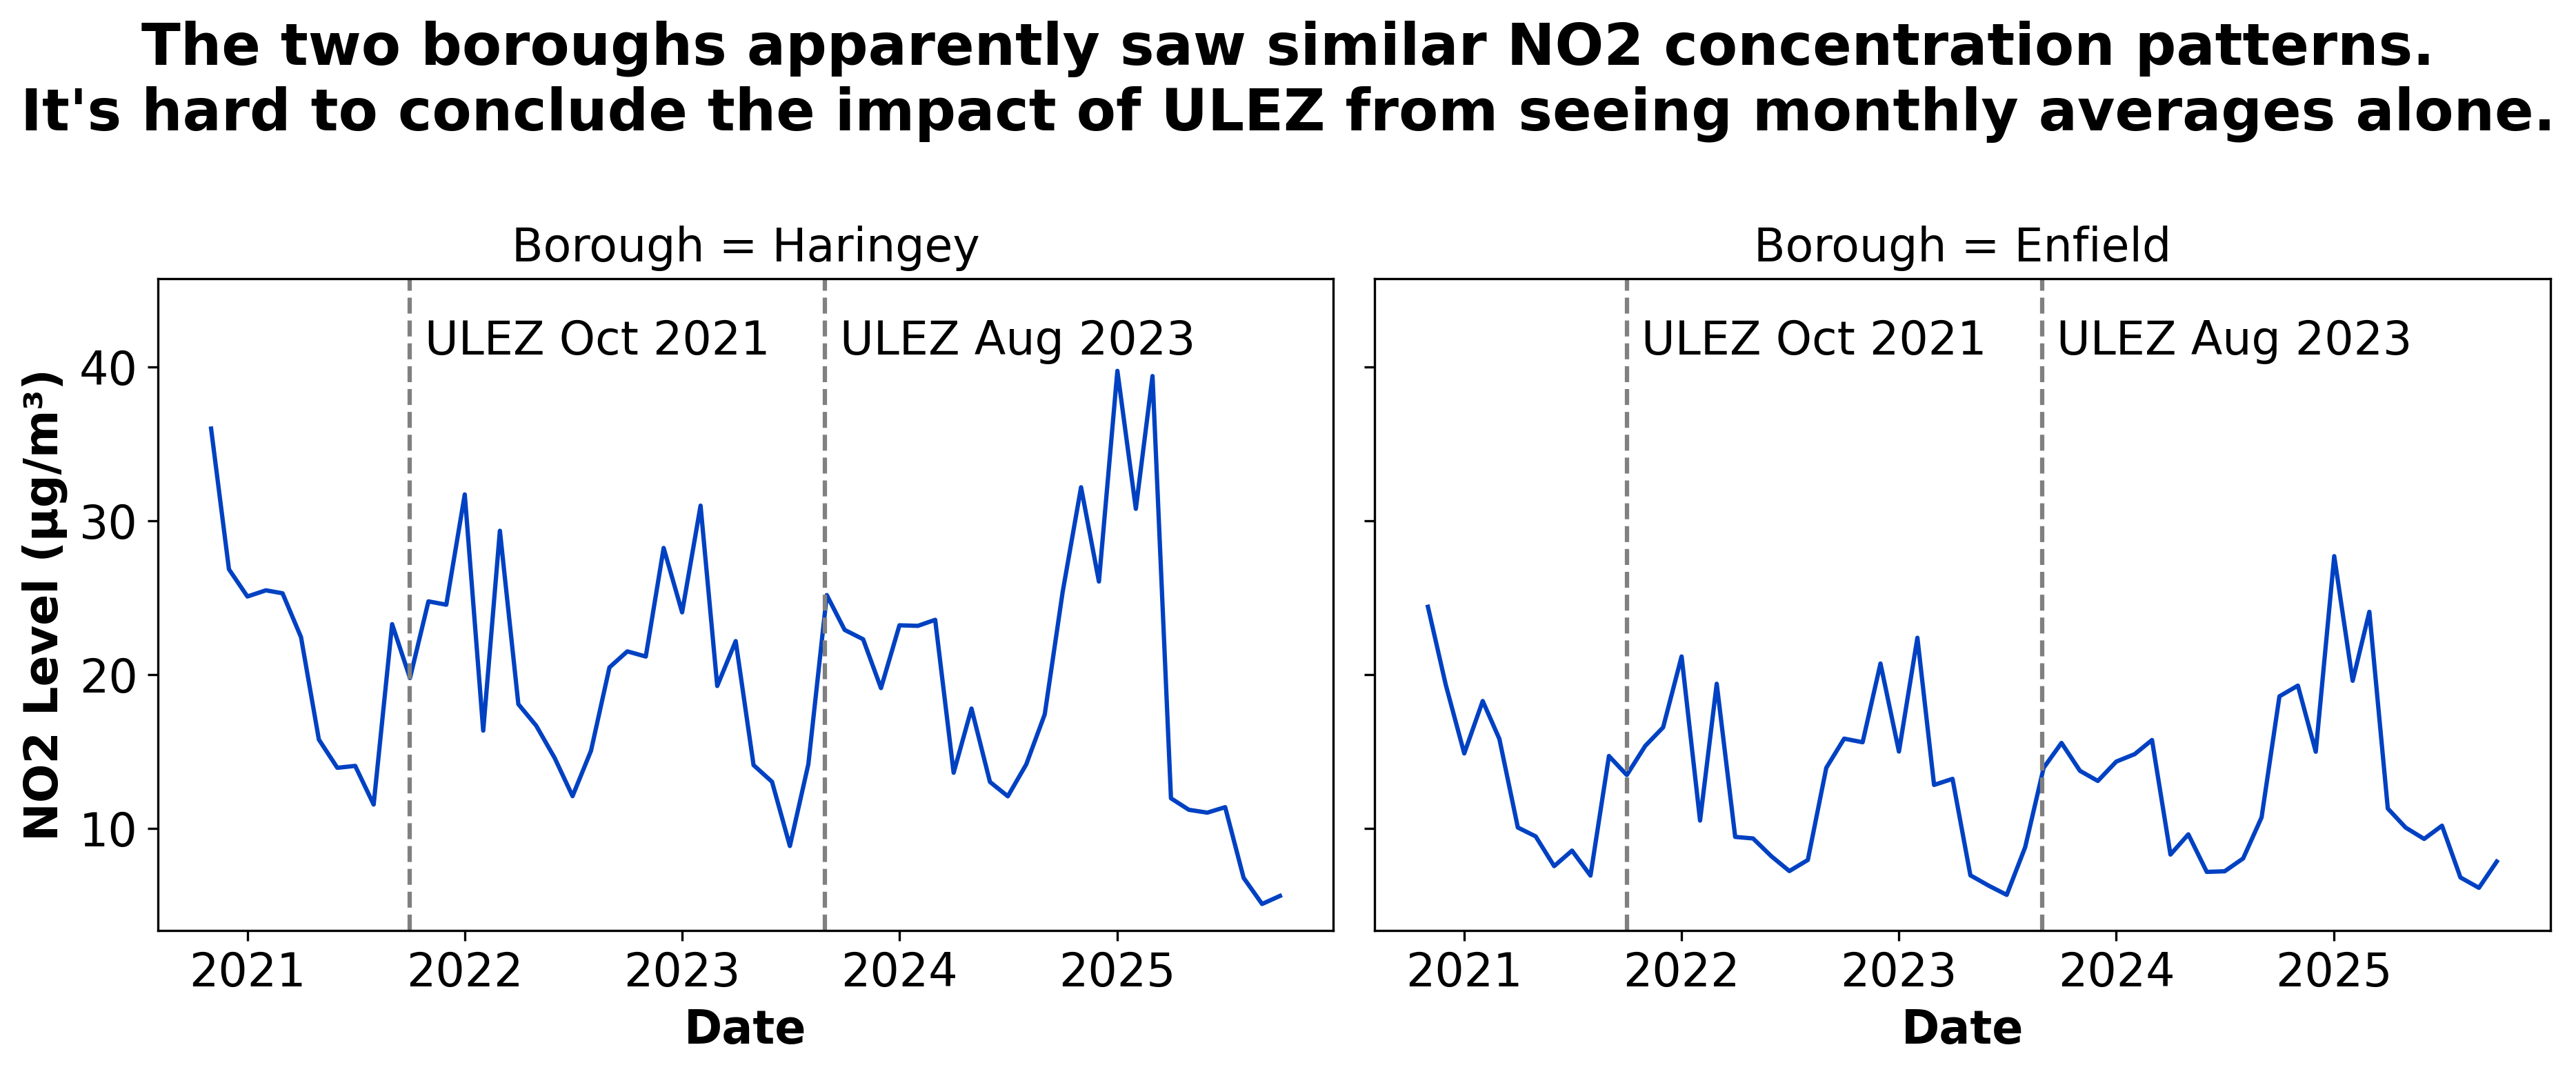
Let’s look at excellent work from one of your classmates who compared two London boroughs affected by ULEZ expansion.
👉 I will share the model solution on Nuvolos after the lecture.
Focus on ULEZ
London had this policy to reduce air pollution associated with road traffic called ULEZ. It’s been here for some time but in 2021 and 2023 it was expanded to outer London boroughs.
Aden Grandcourt, one of your classmates, framed his project as a comparison of the impact of ULEZ on air quality (\(NO_2\) concentration) in two neighbouring boroughs:
- Haringey
- Enfield
This solution addresses the main question we posed: “Is London’s air getting better or worse?” in a creative and interesting way.

Insight 1
Credit: Aden Grandcourt (✍️ Mini-Project 1 submission) - with permission.
Photo source: National Park City.
Insight 2
| Location | Pre to 1st Expansion % | 1st to 2nd Expansion % | Overall % Change |
|---|---|---|---|
| Haringey | -13.10% | -7.08% | -19.26% |
| Enfield | -7.56% | -6.41% | -13.48% |
Credit: Aden Grandcourt (✍️ Mini-Project 1 submission) - with permission.
The For Loop Approach (Perfectly Acceptable!)
Here’s how many of you solved the JSON parsing problem in MP1:
✅ This approach is fully aligned with how we taught in this course so far!
The student understood the data structure, navigated nested dictionaries correctly, and successfully extracted the needed values.
Code adapted from Aden Grandcourt (✍️ Mini-Project 1 submission) - with permission.
Here’s a more direct approach…
I did a Ctrl + F search for json_normalize in your submission notebooks and found that 44/81 of you discovered this simpler approach
Before (for loop):
- 6 lines of code
- Manual navigation
- Easy to make human mistakes
After (json_normalize()):
- 1 line of code
- Automatic flattening
- Less error-prone
What json_normalize() Does
Input: Nested JSON structure
Output: Clean DataFrame
| dt | components.no2 | components.pm2_5 |
|---|---|---|
| 1606435200 | 15.2 | 8.5 |
📋 Note: Nested dictionaries become columns with dot notation (components.no2). Lists of dictionaries become rows.
Here’s another way
You could also get rid of that import json and use pandas straightaway to parse the JSON data into a DataFrame:
If that was the same JSON we saw in the previous slide, the output would look like this:
This produces a DataFrame with a single row (index: 0) and a single column called list - not the best name for a column.
📋 Note: Note, though, that this is not a very useful DataFrame. The data is nested in the list column. We will need to normalise it - also using json_normalize() - to get a useful DataFrame.
Here’s another way (Series)
You could also have chosen the typ to be series to get a Series object instead of a DataFrame.
The output would look like this:
📋 Remember: pandas Series are like one-dimensional numpy arrays with labelled indices. That is, kind of like a dictionary but with more functionality. You can do things like series.apply(), series.value_counts(), series.sort_values(), etc.
📋 Also remember: Each column in a pandas DataFrame is a Series.
3️⃣ json_normalize() Deep Dive
Let’s explore the powerful parameters that make json_normalize() handle complex structures.
Basic Flattening (What We Just Saw)
What it does:
- Flattens nested dictionaries into columns
- Uses dot notation for nested keys (
components.no2) - Creates one row per item in the list
Flattening the Air Quality Data - Slide 01
Flattening the Air Quality Data - Slide 02
Full example
Here is code you could have used in your ✍️ Mini Project 1 if you knew about json_normalize():
I will completely ignore the coord key and focus just on list:
Which looks like this:
Flattening the Air Quality Data - Slide 03
Full example
Here is code you could have used in your ✍️ Mini Project 1 if you knew about json_normalize():
I can convert this list of dictionaries into a (nested) DataFrame using pd.DataFrame():
Which looks like this:
| main | components | dt | |
|---|---|---|---|
| 0 | {‘aqi’: 2} | {‘co’: 347.14, ‘no’: 33.53, ‘no2’: 41.13, ‘o3’: 0.01, ‘so2’: 7.51, ‘pm2_5’: 18.81, ‘pm10’: 21.35, ‘nh3’: 0.25} | 1606435200 |
| 1 | {‘aqi’: 2} | {‘co’: 293.73, ‘no’: 11.18, ‘no2’: 42.16, ‘o3’: 0.21, ‘so2’: 7.27, ‘pm2_5’: 15.68, ‘pm10’: 18.17, ‘nh3’: 0.01} | 1606438800 |
| 2 | {‘aqi’: 2} | {‘co’: 277.04, ‘no’: 5.64, ‘no2’: 41.81, ‘o3’: 0.32, ‘so2’: 7.33, ‘pm2_5’: 15.31, ‘pm10’: 17.65, ‘nh3’: 0.01} | 1606442400 |
Flattening the Air Quality Data - Slide 04
Full example
Here is code you could have used in your ✍️ Mini Project 1 if you knew about json_normalize():
I can clean it up with the knowledge we have gained so far:
Producing this DataFrame:
| components | dt | Borough | aqi | |
|---|---|---|---|---|
| 0 | {‘co’: 347.14, ‘no’: 33.53, ‘no2’: 41.13, ‘o3’: 0.01, ‘so2’: 7.51, ‘pm2_5’: 18.81, ‘pm10’: 21.35, ‘nh3’: 0.25} | 2020-11-27 00:00:00 | Haringey | 2 |
| 1 | {‘co’: 293.73, ‘no’: 11.18, ‘no2’: 42.16, ‘o3’: 0.21, ‘so2’: 7.27, ‘pm2_5’: 15.68, ‘pm10’: 18.17, ‘nh3’: 0.01} | 2020-11-27 01:00:00 | Haringey | 2 |
| 2 | {‘co’: 277.04, ‘no’: 5.64, ‘no2’: 41.81, ‘o3’: 0.32, ‘so2’: 7.33, ‘pm2_5’: 15.31, ‘pm10’: 17.65, ‘nh3’: 0.01} | 2020-11-27 02:00:00 | Haringey | 2 |
Flattening the Air Quality Data - Slide 05
Full example
Here is code you could have used in your ✍️ Mini Project 1 if you knew about json_normalize():
Now I need to flatten the components dictionary into columns:
which looks like this:
| co | no | no2 | o3 | so2 | pm2_5 | pm10 | nh3 | |
|---|---|---|---|---|---|---|---|---|
| 0 | 347.14 | 33.53 | 41.13 | 0.01 | 7.51 | 18.81 | 21.35 | 0.25 |
| 1 | 293.73 | 11.18 | 42.16 | 0.21 | 7.27 | 15.68 | 18.17 | 0.01 |
| 2 | 277.04 | 5.64 | 41.81 | 0.32 | 7.33 | 15.31 | 17.65 | 0.01 |
It’s starting to look nice! 😀
Flattening the Air Quality Data - Slide 06
To ‘connect’ both DataFrames, we can use a 🆕 new function: pd.concat() to combine them:
which would look like this:
| dt | Borough | aqi | co | no | no2 | o3 | so2 | pm2_5 | pm10 | nh3 | |
|---|---|---|---|---|---|---|---|---|---|---|---|
| 0 | 2020-11-27 00:00:00 | Haringey | 2 | 347.14 | 33.53 | 41.13 | 0.01 | 7.51 | 18.81 | 21.35 | 0.25 |
| 1 | 2020-11-27 01:00:00 | Haringey | 2 | 293.73 | 11.18 | 42.16 | 0.21 | 7.27 | 15.68 | 18.17 | 0.01 |
| 2 | 2020-11-27 02:00:00 | Haringey | 2 | 277.04 | 5.64 | 41.81 | 0.32 | 7.33 | 15.31 | 17.65 | 0.01 |
Flattening the Air Quality Data - Slide 07
If you had multiple boroughs, you could create a custom function to do that whole procedure for you:
def get_air_quality_data(borough_name):
    borough_data = pd.read_json(filename, typ='series')
    ... # same as before
    components = pd.json_normalize(borough_data['components'])
    output = pd.concat([borough_data.drop(columns=['components']), components], axis=1)
    output.assign(Borough=borough_name)
    return output
And then you could call it like this:
Using record_path to Expand Nested Lists
Sometimes you want to keep the parent information when expanding a nested list.
Understanding the Parameters
data: The nested list to expand/normalize.record_path: Path to a key whose value is a list. Each item in that list becomes one row.meta: Which fields from the parent object to keep (added to each row)meta_prefix: Prefix to add to meta columns (prevents conflicts)
Critical point: record_path must point to a key whose value is a list. The list is what creates multiple rows. If the value isn’t a list, you’ll get an error.
Think of it this way: record_path says “make one row per item in this list”, and meta says “but also include this information from the parent”.
Controlling Depth with max_level
Just so you know: You can limit how many levels of nesting get flattened into columns.
Custom Separators
Change the dot notation separator:
When to use: If your column names already contain dots, or you prefer underscores.
What Can json_normalize() Accept?
Works with:
- ✅ Dictionaries (nested structures)
- ✅ Lists of dictionaries
- ✅
pd.Seriescontaining dictionaries or lists
Key point: If you have a DataFrame column containing nested JSON, pass that Series to json_normalize().
When to Use json_normalize()
Use it when:
- ✅ You have nested JSON from APIs
- ✅ You need to flatten dictionaries into columns
- ✅ You have lists of dictionaries
Don’t use it when:
- ❌ Your data is already flat (just use
pd.DataFrame()) - ❌ You need very custom transformations (loops might be clearer)
- ❌ The structure is too complex (consider preprocessing first)
Mini-Project 2 Preview: TfL API Structure
Here’s what the JSON from TfL Journey Planner API looks like (you’ll see this in your MP2 NB01):
Challenge: The transport mode is buried inside legs, which is a list inside each journey. You’ll need to normalize journeys first, then handle the legs list.
4️⃣ Nested JSON Challenge
Time to put your skills to the test!
Speed Challenge 🏆
Task: Normalize the JSON structure I’m giving you right now into an informative, analysis-ready DataFrame. Share your solution on Slack with a screenshot of your DataFrame.
Time: 15 minutes
Prize: Most elegant solution wins a tote bag! 🎁
Criteria for “elegant”:
- Code is clean and readable
- DataFrame structure is useful for analysis
- Solution demonstrates understanding of
json_normalize()parameters
☕ Coffee Break

After the break:
- OpenSanctions challenge showcase
- Combining DataFrames with
pd.concat() - Handling list columns with
.explode() - Reshaping data with
.melt()
5️⃣ Other Essential Functions
Beyond json_normalize(), here are other reshaping tools. We’re showing you these now so you can recognise them. You’ll see more examples in W08 (databases) and W09 (visualisations).
🫨 DON’T PANIC! We’re showing you these now so you can recognise them. You’ll see more examples in 🖥️ W08 Lecture and 🖥️ W09 Lecture.
Combining DataFrames with pd.concat()
When you have multiple DataFrames (e.g., from different locations or time periods):
Before:
df_location1:
| location | NO2 |
|---|---|
| Haringey | 20.5 |
df_location2:
| location | NO2 |
|---|---|
| Enfield | 15.3 |
After:
df_all:
| location | NO2 |
|---|---|
| Haringey | 20.5 |
| Enfield | 15.3 |
Key parameter: ignore_index=True resets the index (0, 1, 2… instead of keeping original indices)
When You Need concat()
Use it when:
- ✅ You normalized multiple JSON files
- ✅ You have data from different sources
- ✅ You need to combine results from different time periods
Example from MP1: Combining Haringey and Enfield data into one DataFrame
Handling List Columns with .explode()
Sometimes after normalization, columns contain lists. .explode() creates one row per list element.
Before:
| name | emails |
|---|---|
| Alice | [‘a@example.com’, ‘b@example.com’] |
| Bob | [‘c@example.com’] |
After:
| name | emails |
|---|---|
| Alice | a@example.com |
| Alice | b@example.com |
| Bob | c@example.com |
Combining json_normalize() and .explode()
Real-world scenario: normalize first, then explode list columns.
Reshaping with .melt(): Wide to Long
Transform from “wide” format (many columns) to “long” format (fewer columns, more rows).
Wide format:
| date | NO2 | PM2.5 |
|---|---|---|
| 2020-01-01 | 20.5 | 8.5 |
Long format:
| date | pollutant | concentration |
|---|---|---|
| 2020-01-01 | NO2 | 20.5 |
| 2020-01-01 | PM2.5 | 8.5 |
The long format is useful for plotting with seaborn.
Why Use .melt()?
Useful for seaborn plots (we’ll see more in W09):
Use it when:
- ✅ You need to plot multiple variables together
- ✅ You want to facet by a variable
- ✅ You want to compare values across categories
Quick Reference: When to Use What
| Function | Use When |
|---|---|
json_normalize() |
Flattening nested JSON from APIs |
pd.concat() |
Combining multiple DataFrames |
.explode() |
Columns contain lists that need separate rows |
.melt() |
Converting wide format to long for plotting |
6️⃣ Wrap-up & Next Steps
Key Takeaways
Today you learned:
- ✅
pd.json_normalize()- Automatically flattens nested JSON - ✅
record_pathandmeta- Control how nested lists expand - ✅
pd.concat(),.explode(),.melt()- Reshaping tools you’ll see again in W08 and W09
Remember: Your for loop solutions from MP1 were correct! These tools make your code simpler, but understanding the data structure (which you demonstrated) is the most important skill.
Tomorrow’s Lab
In tomorrow’s 💻 W07 Lab, you’ll:
- Practice with the OpenSanctions dataset (similar to today’s challenge)
- Work through complex normalization scenarios
- Combine multiple reshaping techniques
- Create visualisations from normalized data
Mini-Project 2 Preview
Released Week 07, due Week 10 (30% of final grade)
You’ll need these skills to:
- Collect data from TfL Journey Planner API (nested JSON)
- Normalize journey data using
json_normalize() - Combine data from multiple sources
- Create insights about transport connectivity
Model Solution Available
The full model solution from ✍️ Mini-Project 1 (with excellent reflections) is now available on Nuvolos.
Location: mp1-model-solution/ on Nuvolos
Questions?
Resources:
- 📓 Lecture notebook (downloadable on Nuvolos)
- 💻 W07 Lab tomorrow
- 💬 Post questions in
#helpon Slack - 📅 Attend drop-in sessions
Looking ahead: 🖥️ W08 Lecture introduces databases and SQL, a natural next step after mastering data reshaping!
![]()
LSE DS105A (2025/26)