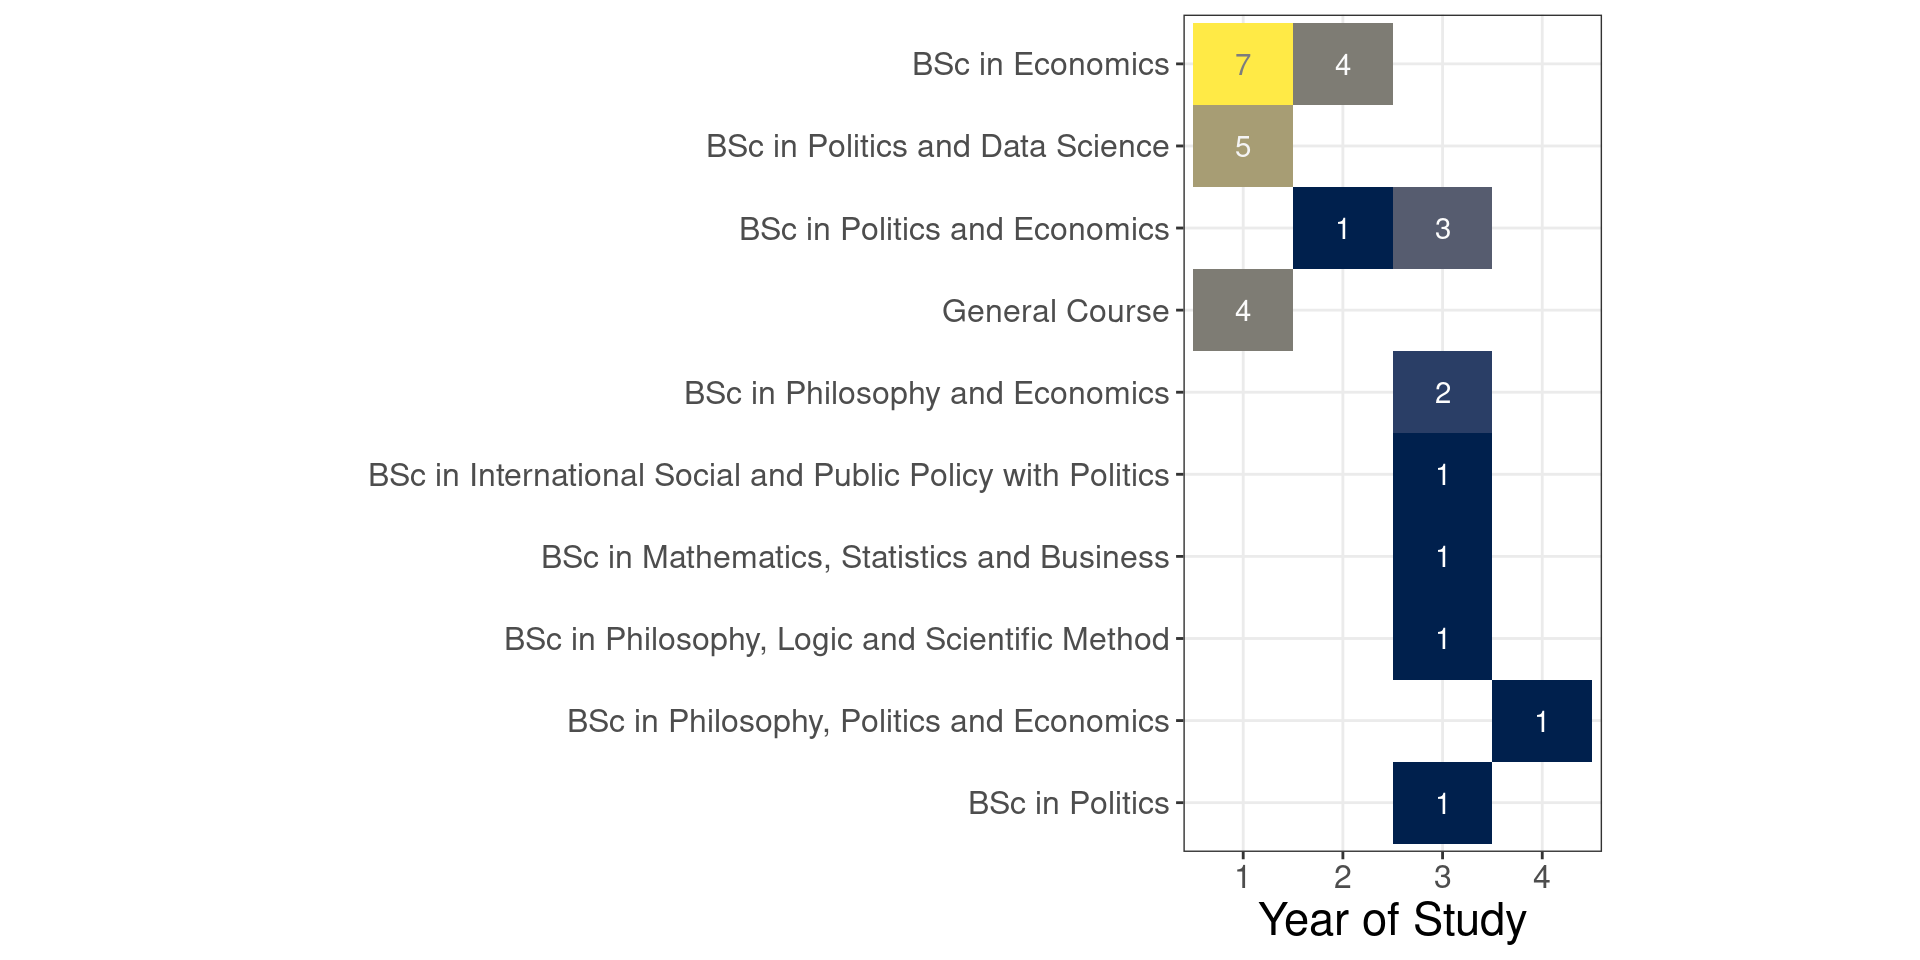
| Programme | Freq |
|---|---|
| BSc in Economics | 11 |
| BSc in Politics and Data Science | 5 |
| BSc in Politics and Economics | 4 |
| General Course | 4 |
| BSc in Philosophy and Economics | 2 |
| BSc in International Social and Public Policy with Politics | 1 |
| BSc in Mathematics, Statistics and Business | 1 |
| BSc in Philosophy, Logic and Scientific Method | 1 |
| BSc in Philosophy, Politics and Economics | 1 |
| BSc in Politics | 1 |
DS105 Data for Data Science
🗓️ Week 01 - Part I: Structure of the course
9/30/22
The Data Science Institute
- This course is offered by the LSE Data Science Institute (DSI).
- DSI is the hub for LSE’s interdisciplinary collaboration in data science
The Data Science Institute
Activities of interest to you:
- CIVICA Seminar Series
- Careers in Data Science
- Social events
- Industry “field trips”
- Summer projects
Your lecturer
Dr. Jonathan Cardoso-Silva
- PhD in Computer Science
- Background: Computer Science,Engineering,Data Science
- Research:
- Networks
- Optimisation
- Machine Learning applications
- Data Science Workflow
Teaching Assistants
Anton Boichenko
Guest Teacher at the DSI
Product Developer at Decoded
MSc in Applied Social Data Science (LSE)
Mustafa Can Ozkan
Guest Teacher at the DSI
PhD cand. in the Spacetime Lab (UCL)
MSc in Transport (Imperial/UCL)
Dr. Stuart Bramwell
ESRC Postdoctoral Fellow
Department of Methodology
PhD in Politics (Oxford)
Xiaowei Gao
Guest Teacher at the DSI
PhD cand. in the Spacetime Lab (UCL)
MSc in Data Science (KCL)
Yijun Wang
Guest Teacher at the DSI
PhD cand. in Health Informatics (KCL)
MSc in Data Science (KCL)
Degree Programme vs Year of Study
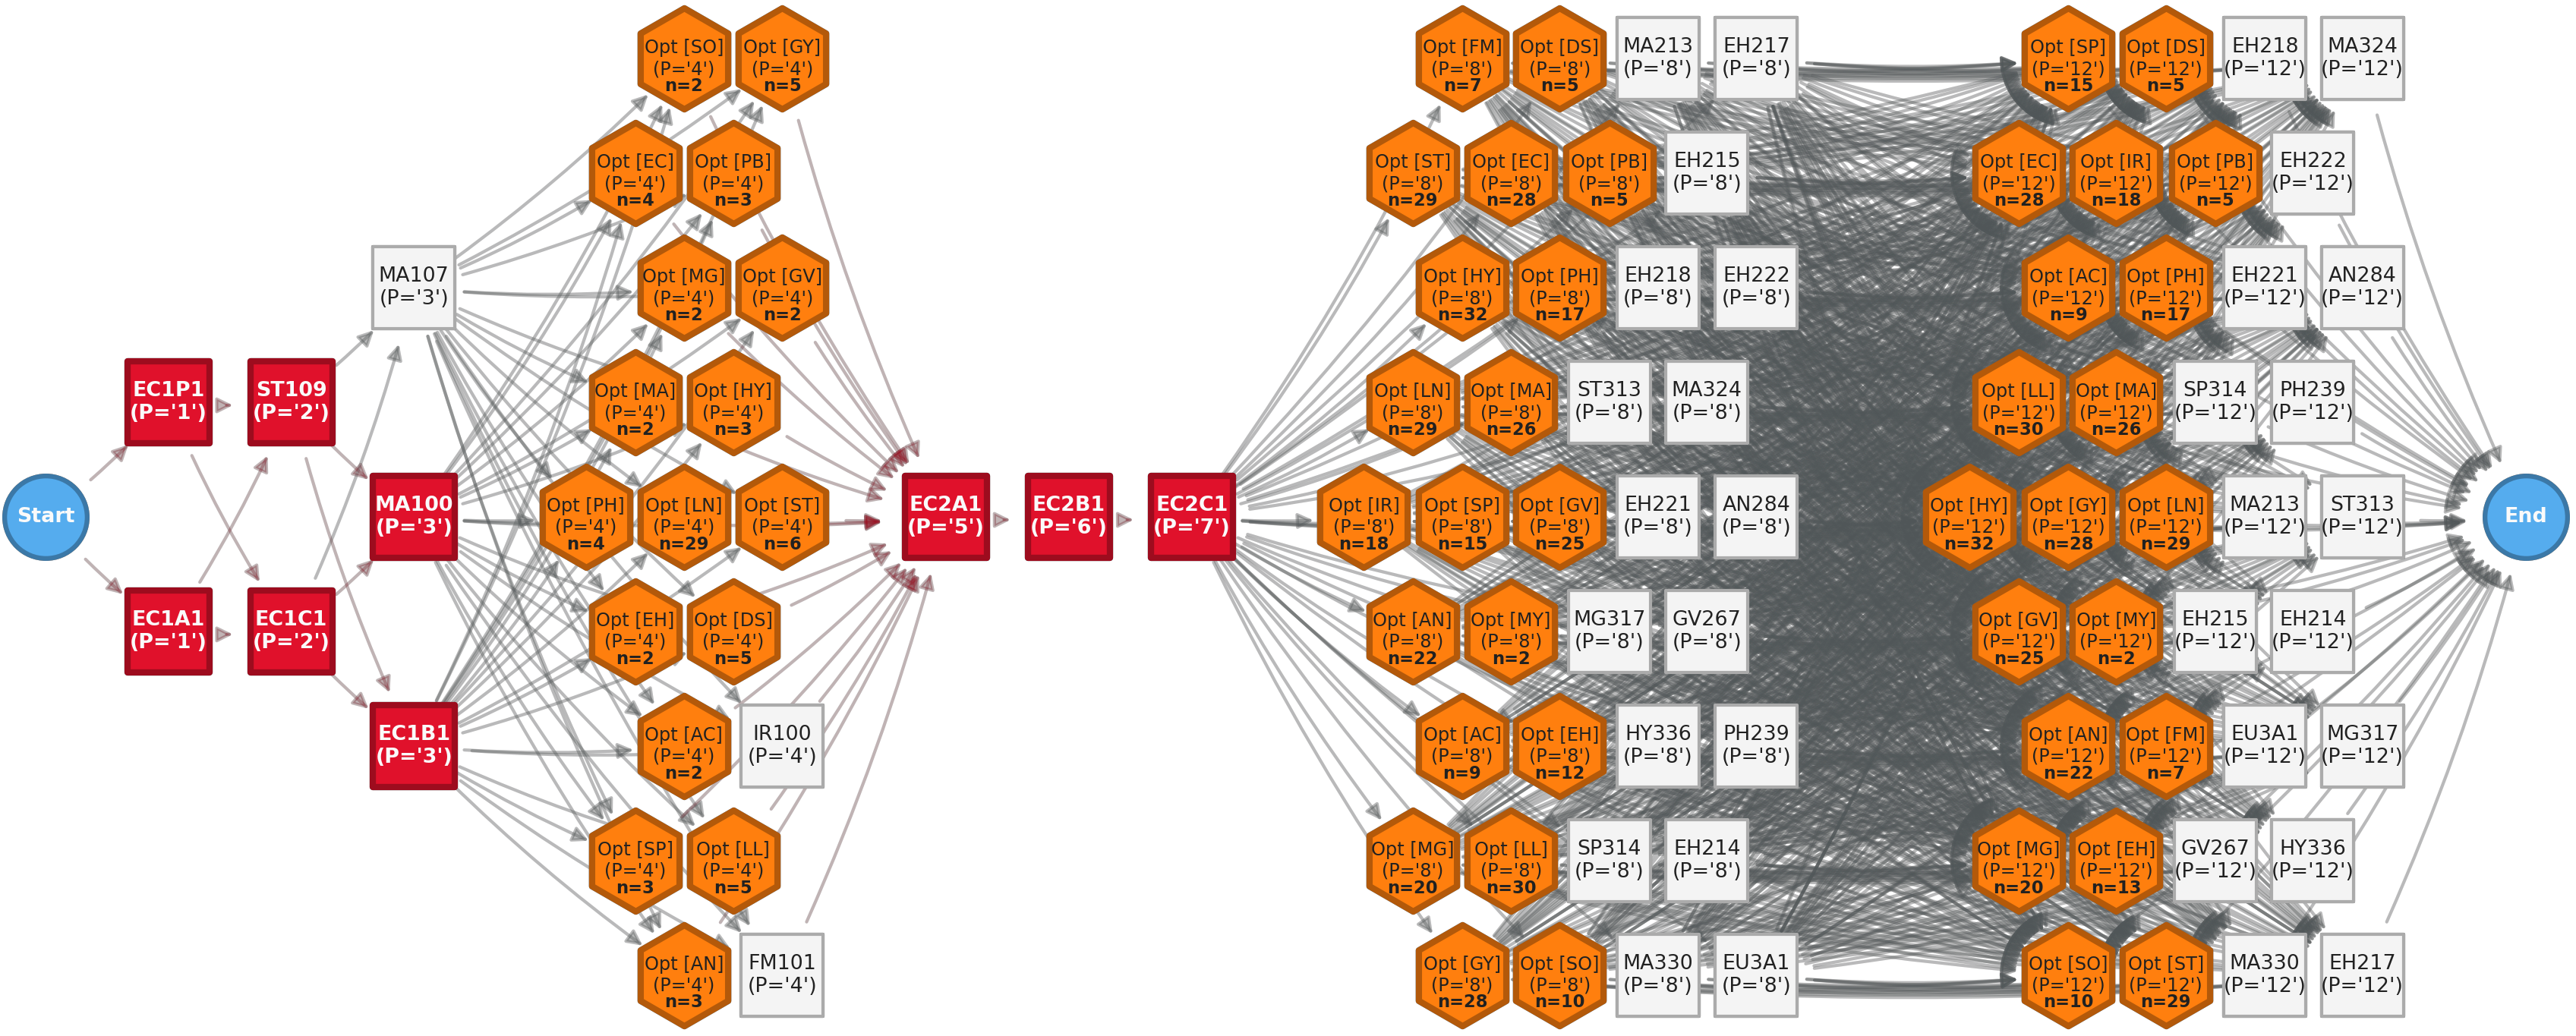
BSc in Economics - Course Selection Options
Any questions?
How did we get here?
This abundance of data is strongly associated with the dramatic changes in technology in the past few decades.
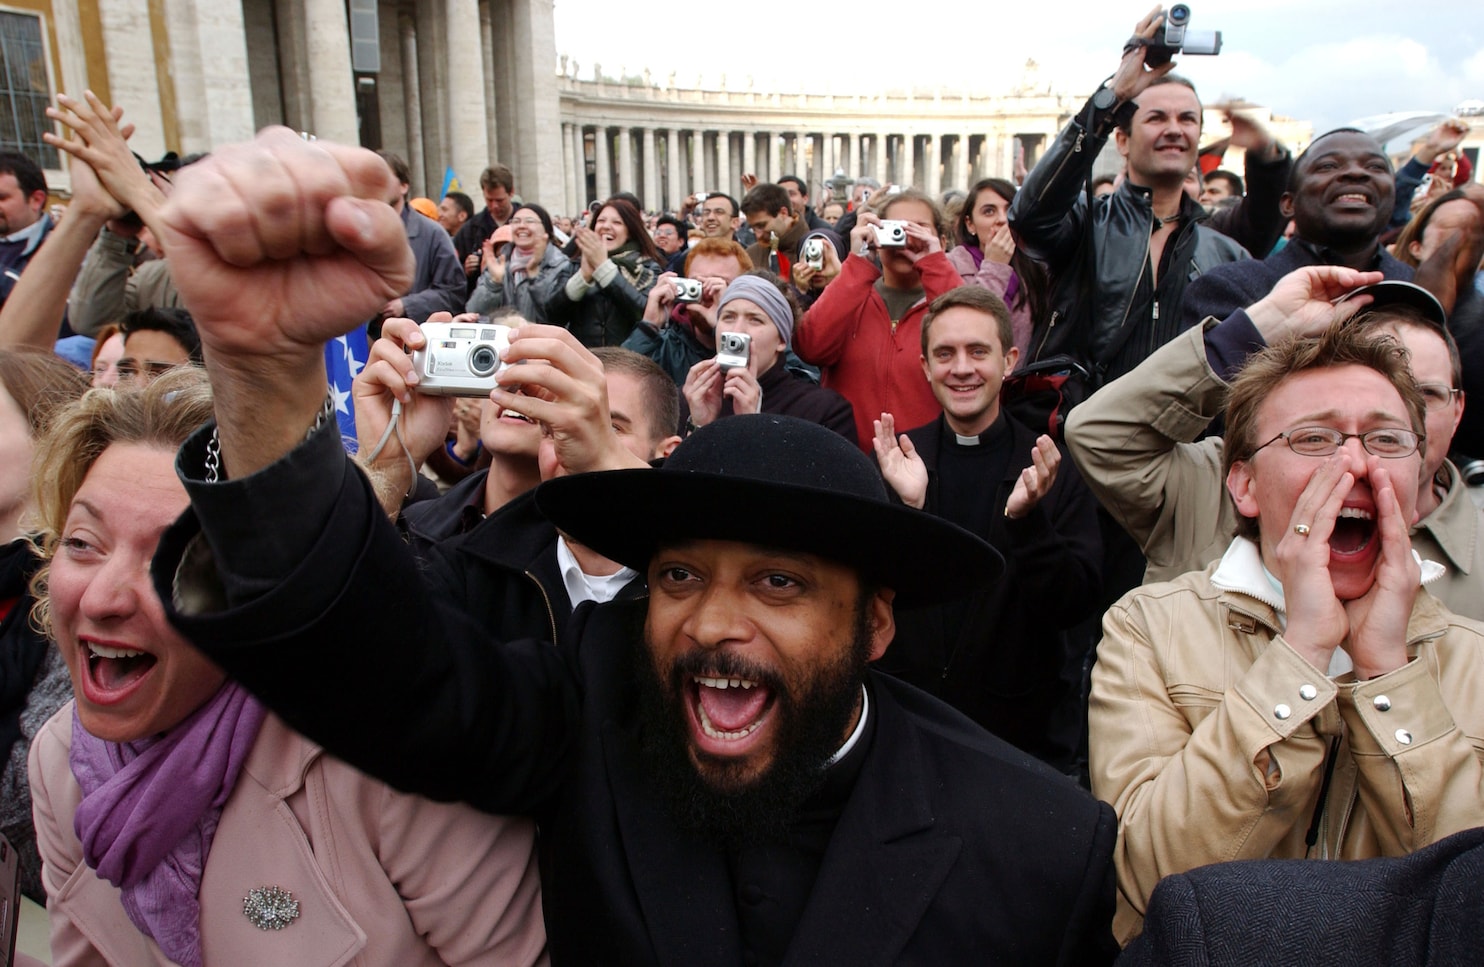
St.Peter’s Basilica at the Vatican in
📅 19 April 2005
when Ratzinger
was elected the 265th pope.
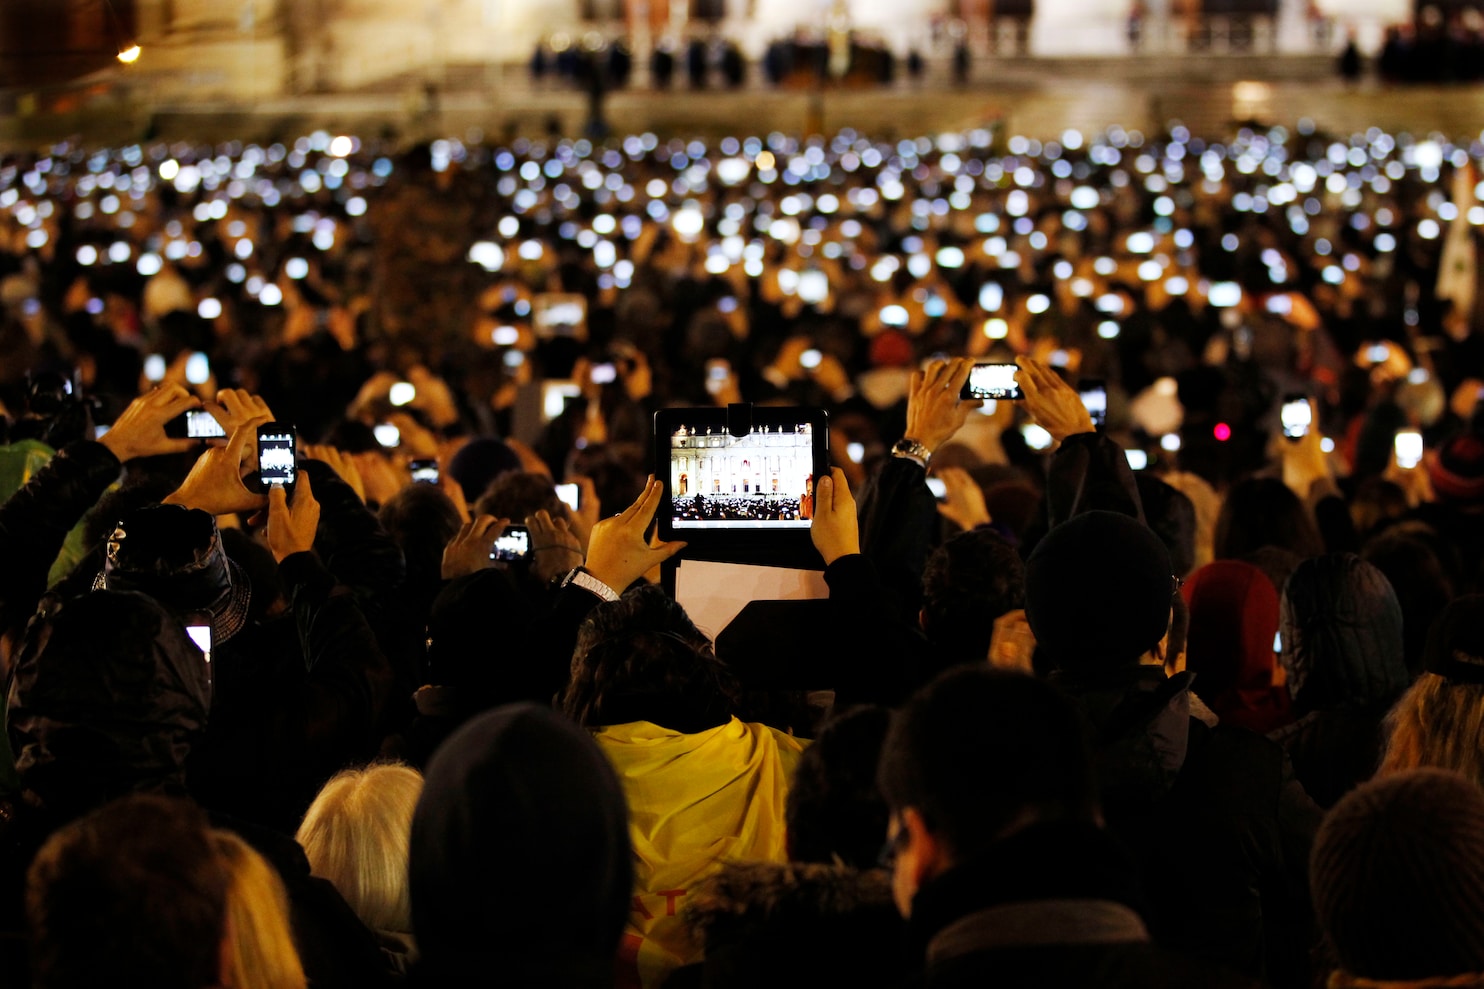
St.Peter’s Basilica at the Vatican in
📅 13 March 2013
when Pope Francis
was elected the 266th pope.
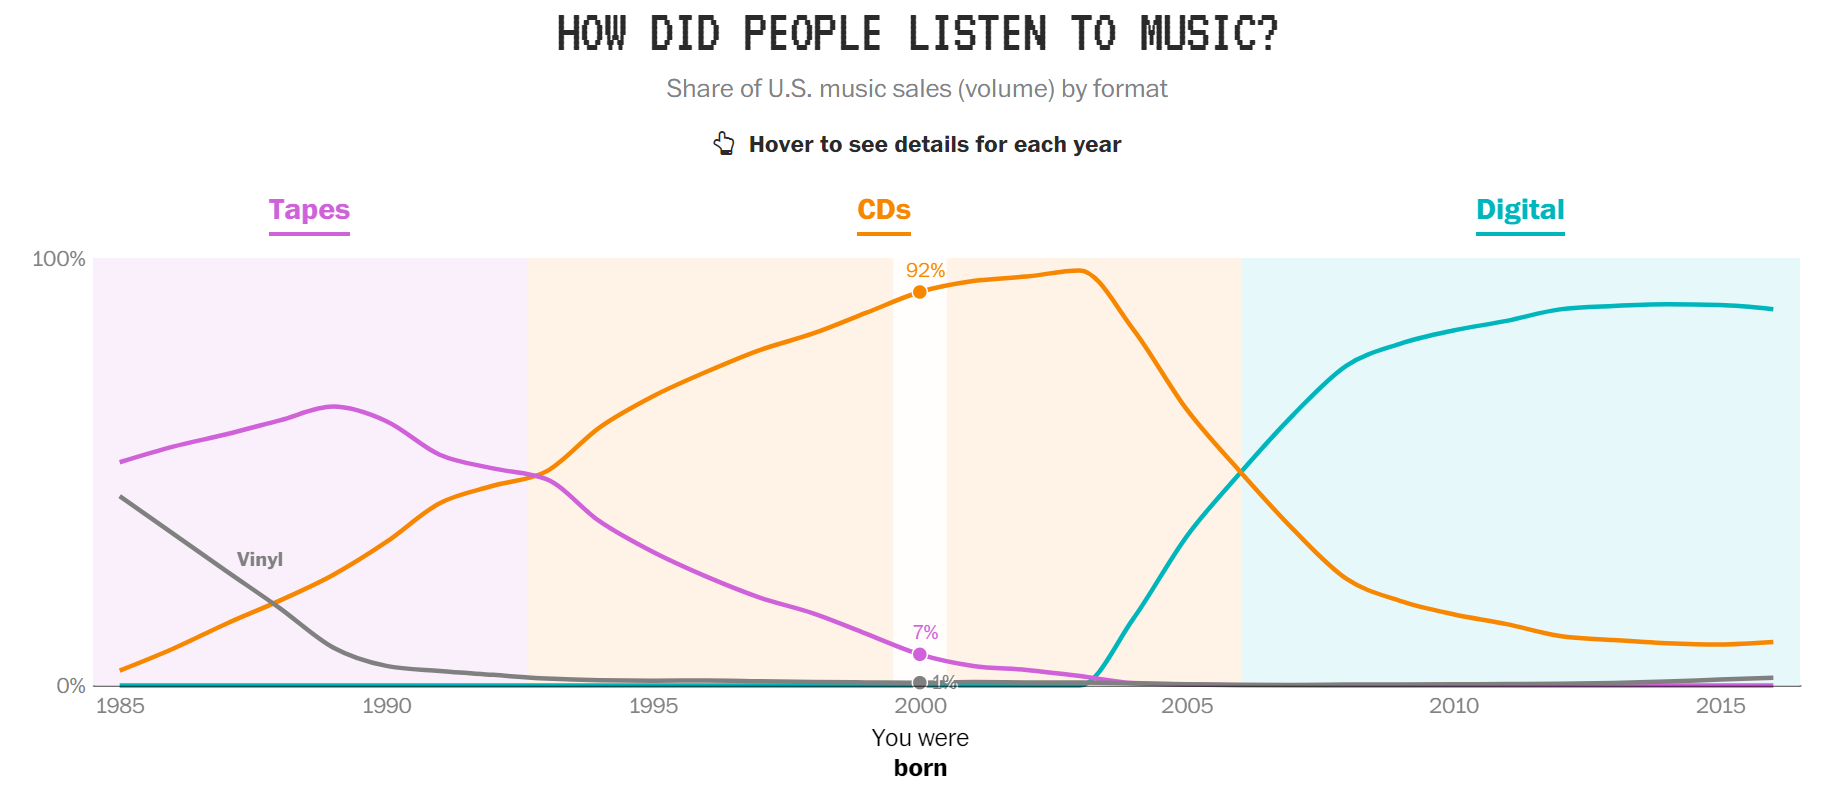
We changed how we consume music 🎧
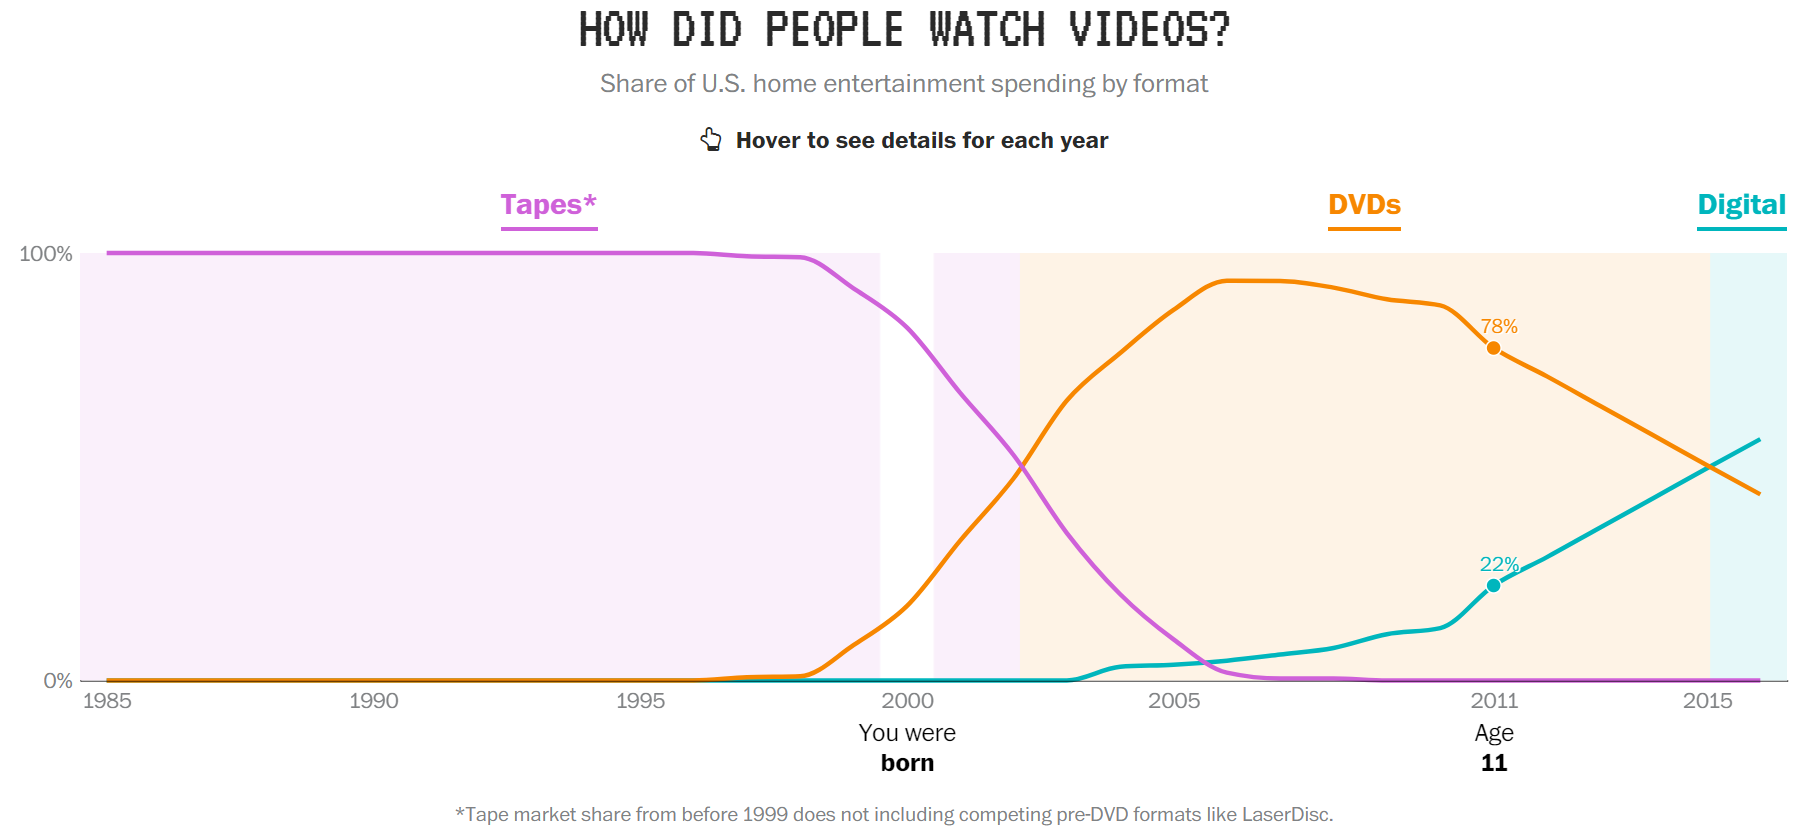
We changed how we consume video 🎞️
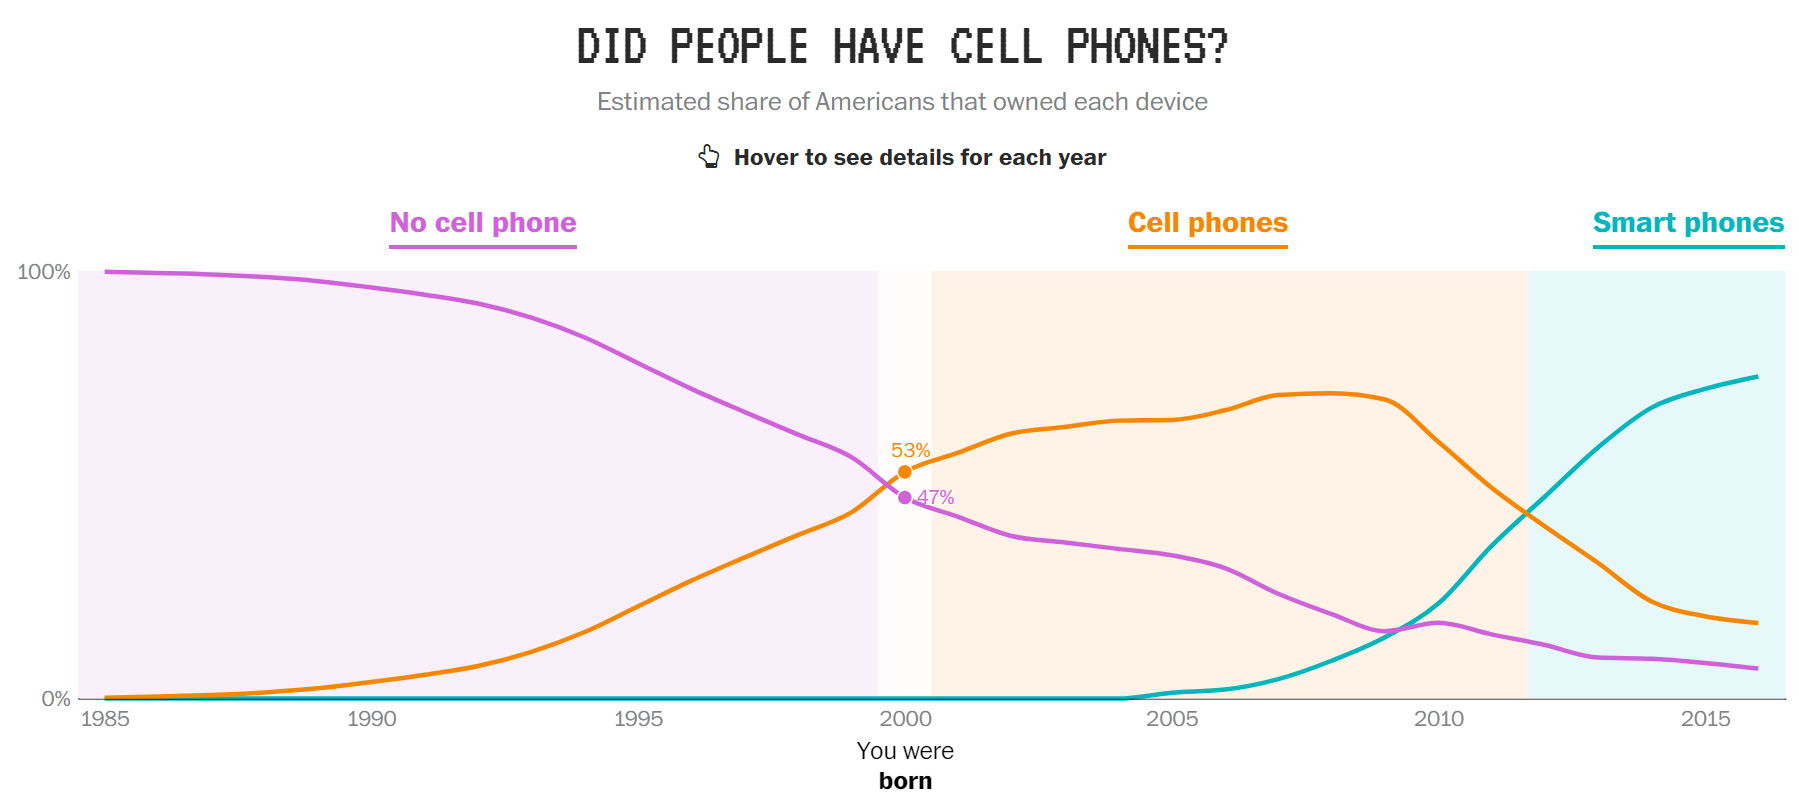
Smartphones 📱 are a very recent thing
References
Fischer-Baum, Reuben. 2017. “What ‘Tech World’ Did You Grow up In?” Washington Post. https://www.washingtonpost.com/graphics/2017/entertainment/tech-generations/.
Kolawole, Emi. 2013. “About Those 2005 and 2013 Photos of the Crowds in St. Peter’s Square.” Washington Post. http://wapo.st/WKKTMh.