What you do with these is only limited by your creativity.
Yesterday’s Notebook
Let me walk you through what you built yesterday.
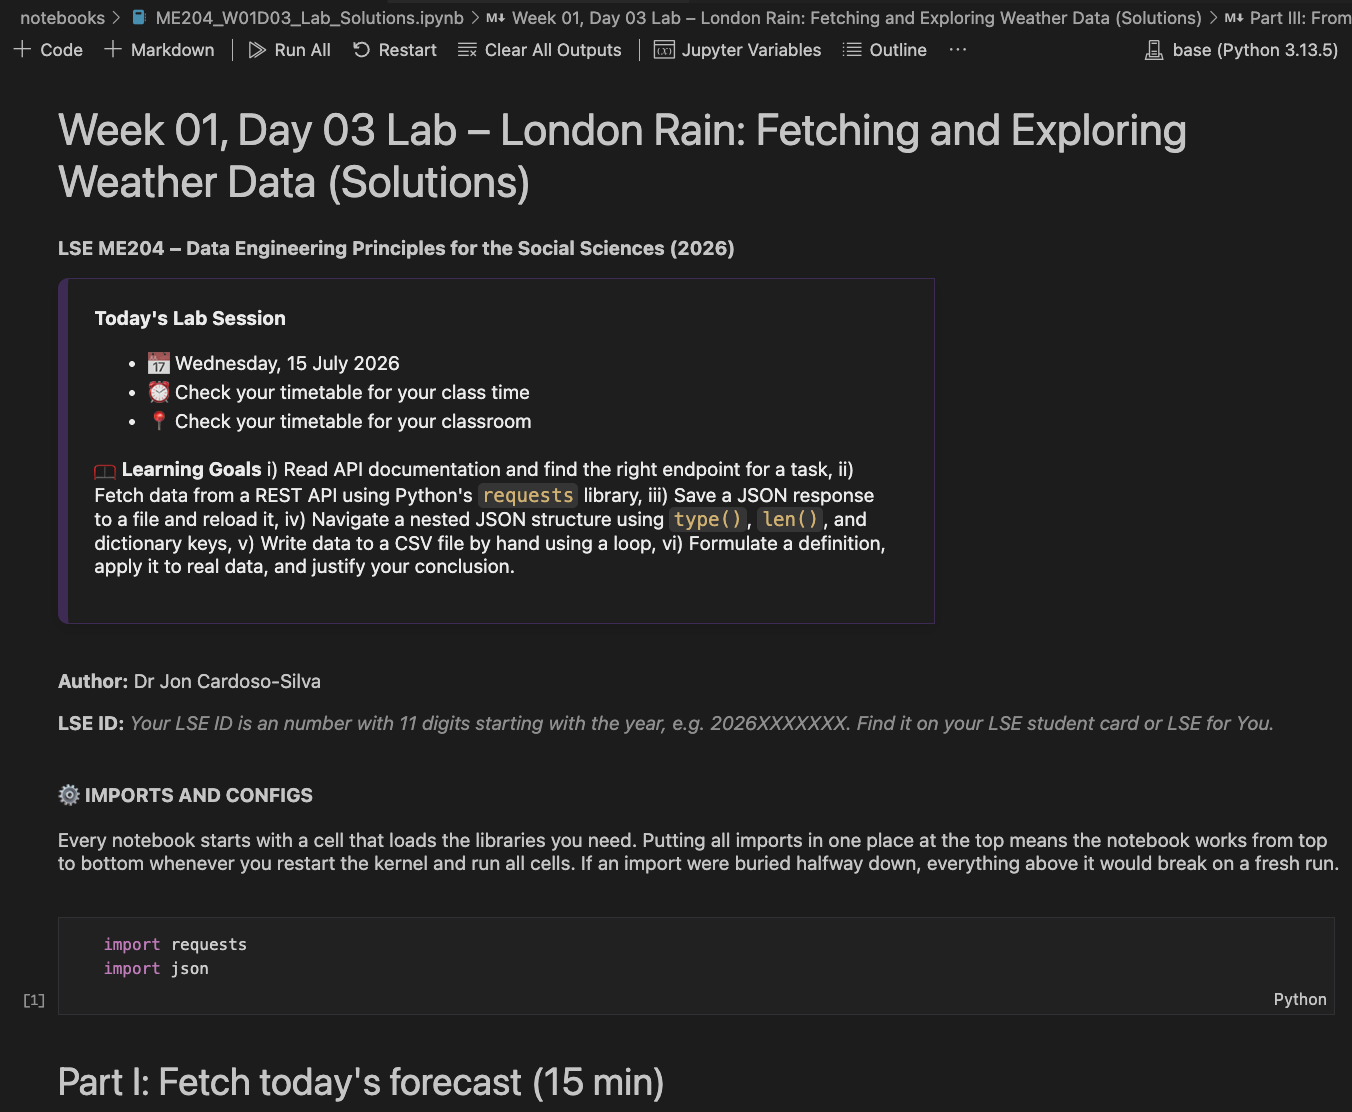
Your W01D03 notebook: fetching weather data, navigating JSON, writing CSV by hand.
🔍 Find the Heavy Rain Days
Find every day in your london_2025.csv where rainfall was above 10mm. For each one, print the date, the rain total, and the precipitation total.
To load the file:
withopen("../data/weather/london_2025.csv") as f: lines = f.readlines()
Use whatever you prefer: a .py script, ipython, or a Jupyter notebook.
Expected output:
2025-01-01  rain 10.5 mm  precip 10.5 mm
2025-01-05  rain 18.8 mm  precip 22.3 mm
2025-01-26  rain 11.0 mm  precip 11.0 mm
2025-02-24  rain 13.2 mm  precip 13.2 mm
2025-06-07  rain 13.2 mm  precip 13.2 mm
2025-07-19  rain 16.2 mm  precip 16.2 mm
2025-07-31  rain 26.7 mm  precip 26.7 mm
2025-08-29  rain 19.5 mm  precip 19.5 mm
2025-09-03  rain 25.6 mm  precip 25.6 mm
2025-10-03  rain 12.4 mm  precip 12.4 mm
2025-10-23  rain 14.2 mm  precip 14.2 mm
2025-11-14  rain 15.2 mm  precip 15.2 mm
2025-11-22  rain 10.4 mm  precip 10.4 mm
2025-12-05  rain 10.6 mm  precip 10.6 mm
2025-12-18  rain 17.7 mm  precip 17.7 mm
Find the method the AI used. Is it real? Are the parameters correct?
Change one thing (the colour, the format, or which column gets highlighted) using the documentation, not the AI.
The Principle
Do the DataFrame transformation yourself. That is where your analytical thinking is.
Once you have the table you want to present, ask the AI for the styling code. Formatting is where AI tools save you time, while the table design stays yours.
Then check the output against the docs. AI tools sometimes invent method names or use parameters that do not or no longer exist.
If you use a technique that was not covered in lectures or labs, include a markdown cell that:
(a) explains why you chose it, and
(b) walks through how you tested and validated each step, as if you were writing a short tutorial for yourself.
This applies to techniques from the pandas documentation, from Stack Overflow, or from an AI tool.
This is one way to show us you did not blindly copy-paste from an AI but steered it to show you something new and relevant. We will check how coherent it is with the course material and with your own writing and coding style elsewhere in your submission.
5️⃣ What Comes Next
12:15 – 13:00
This Afternoon’s Lab
Start your midterm: sign up for OpenWeather, set up your project folder, store your API key in a .env file, and make your first authenticated request.
The lab page, Authenticating to APIs, has the step-by-step instructions. Your class teacher is there for technical setup.
Saving a DataFrame
df.to_csv("london_2025_monthly.csv", index=False)
.to_csv() writes your DataFrame to a CSV file.
The lab has a surprise about this method. See if you can spot what goes wrong.
Dates Are Strings (For Now)
The dates in your DataFrame are strings right now.
"2025-01-01" is text, not a date. pandas cannot sort by month or filter by season until it knows the column holds dates.
Next week you will meet pd.to_datetime(), which turns those strings into proper dates. The lab has a <details> block that previews it.
✍️ Midterm Project
⏳ Deadline
Tuesday, 21 July 2026 at 8 pm UK time
💎 Weight
25% of your final grade
📂 Submission
Nuvolos assignment hand-in
🤖 AI policy
Position 3: full authorised use
The Question
“Do coastal cities cool down faster at night than inland cities?”
You will use the OpenWeather API, a different API from the Open-Meteo service you used in the labs.
This afternoon in the lab: sign up for a free API key at openweathermap.org and start reading their documentation.
Recommended Work Pattern
Thursday 16
Friday 17
Sat-Sun
Monday 20
Tuesday 21
AM
W01D04 Lecture
Free day
W02D01 Lecture: plotly charts
W02D02 Lecture: vectorised pandas
PM
W01D04 Lab (Authenticating to APIs). Midterm released.
Work on NB01 + start NB02. Enjoy London!
Enjoy London
W02D01 Lab (chart practice). Start NB03.
Refactoring workshop. Polish and hand in.
Evening
Keep collecting data. Read OpenWeather docs.
8 pm: Deadline.
Valid code written with for loops can score to 70%. If you refactor after Tuesday’s lecture, add a note saying what you changed and why.
Thanks!
13:00
This afternoon, open the lab page and get started on your midterm project setup.The midterm brief is on the course site.
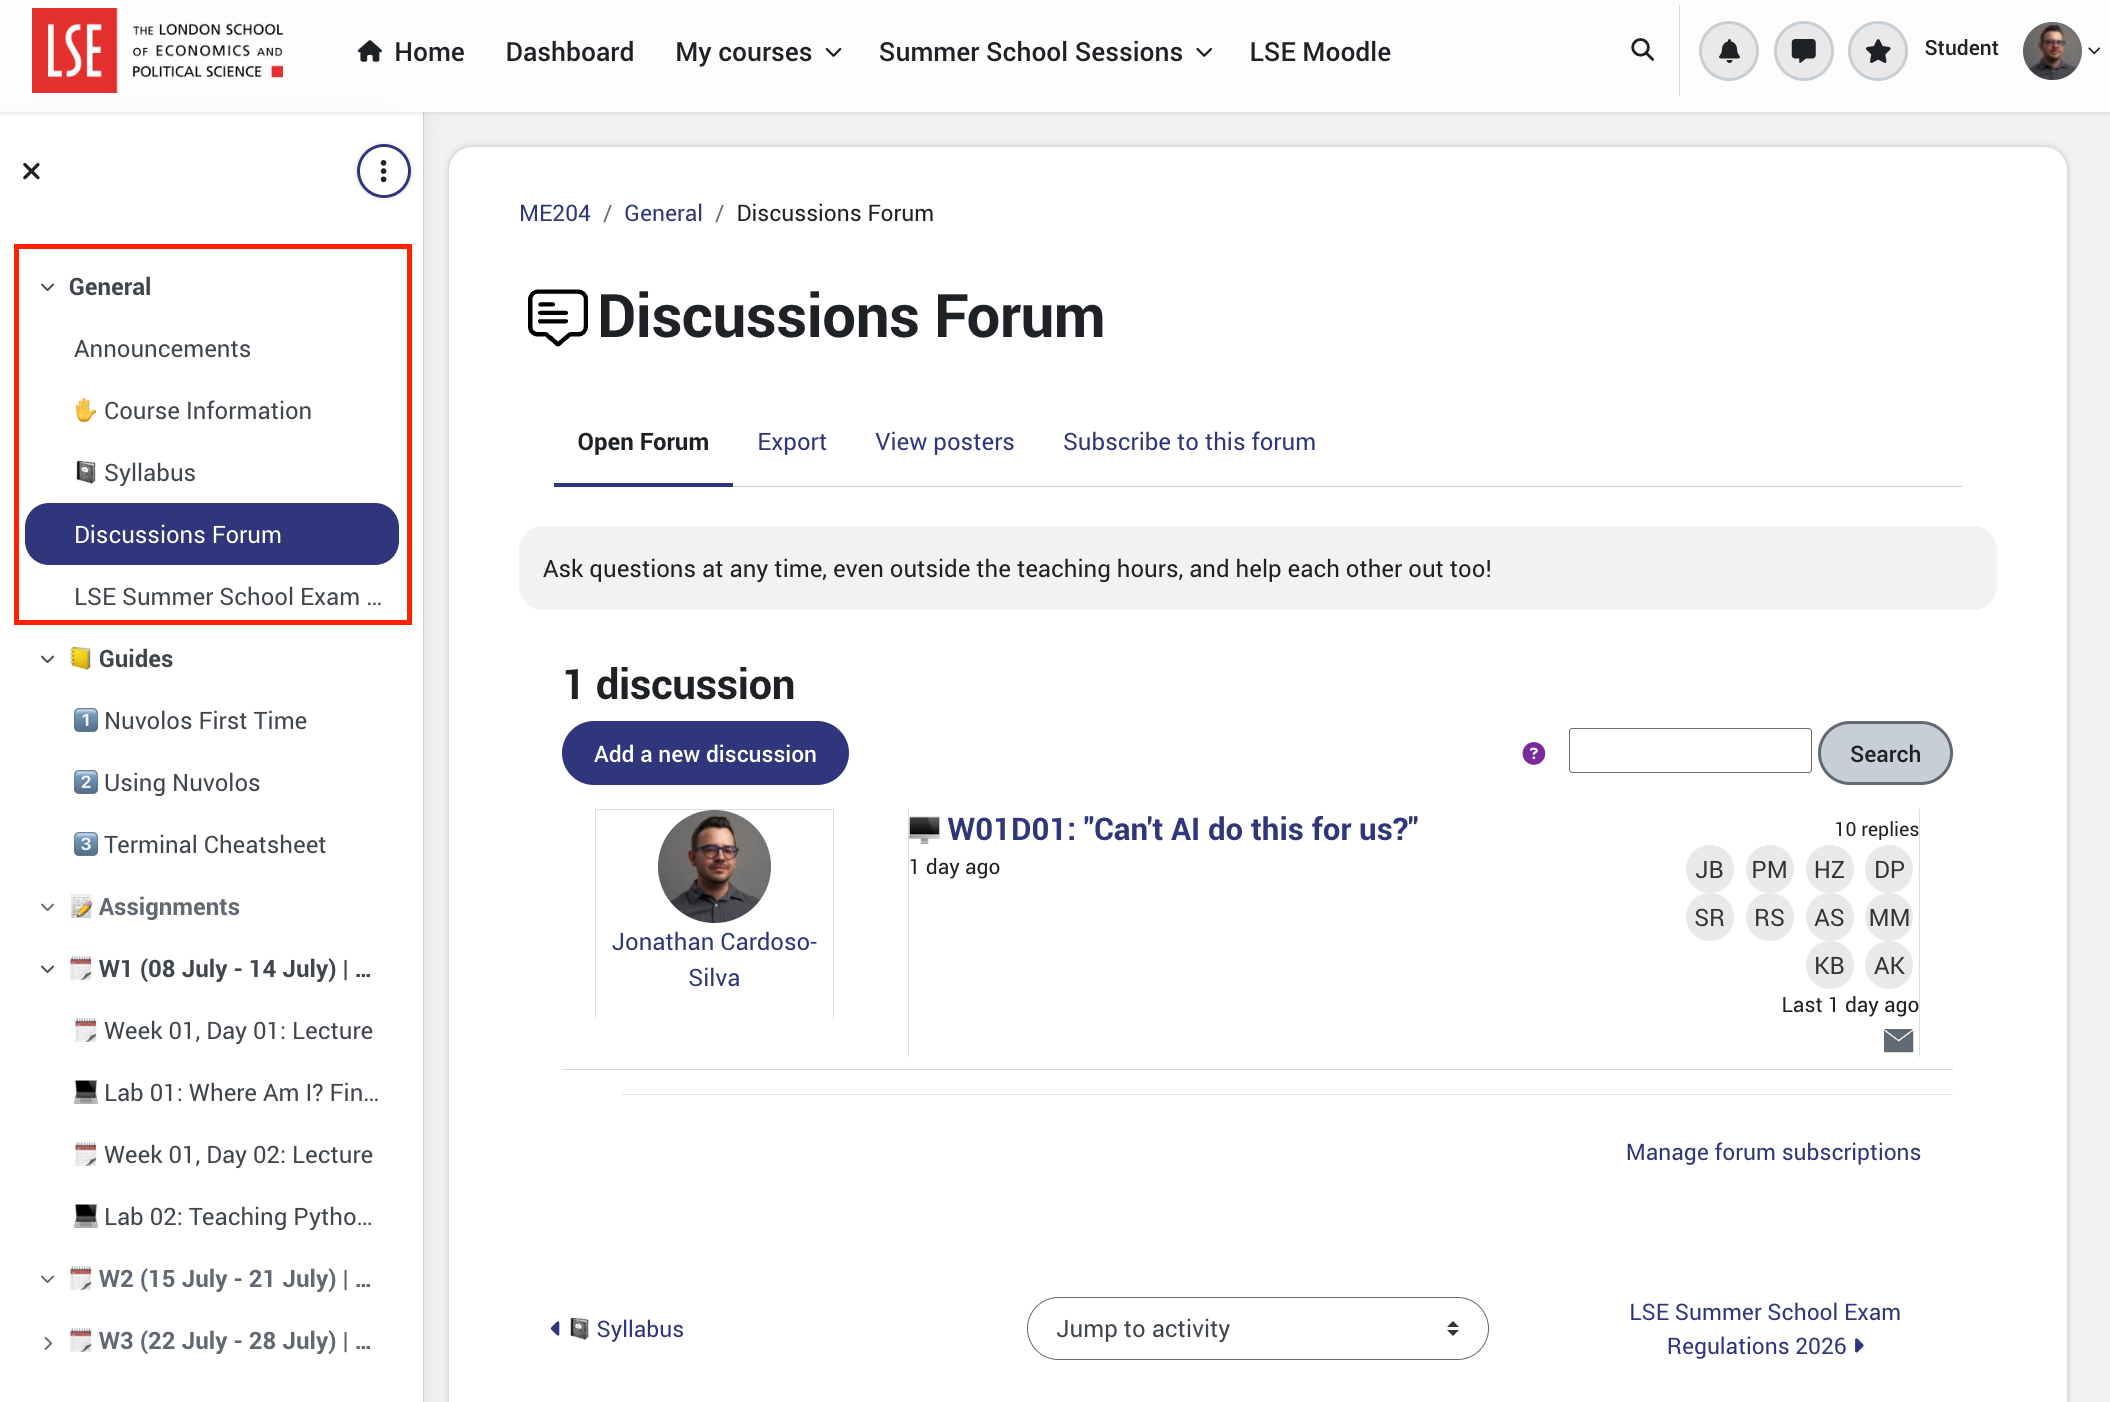
💬 Post questions and observations to the Discussion Forum on Moodle. Your class teacher is also there to help during the afternoon lab.