LSE ME204 · Data Engineering Principles for the Social Sciences
🖥️ Week 01 Day 01 Lecture
Welcome to the Course

Your lecturer
Dr Jon Cardoso-Silva
🌐 jonjoncardoso.github.io
📧 J.Cardoso-Silva@lse.ac.uk
Assistant Professor (Education)*
AI and Education Fellow 
* Becoming Associate Professor from 1 Aug 2026.
Background:
- PhD in Computer Science (King’s College London)
- Industry experience in software development and as a lead data scientist
Highlighted research:

GENIAL and the LSE AI and Education Fellowship
- How generative AI can strengthen learning in programming courses, rather than replace the hard parts students still need to do
- Evidence and practical guidance for GenAI in data science education
📢 I will talk more about our findings after the break!
Your class teacher

Jonas Weinert
Class Teacher
📧 J.Weinert@lse.ac.uk
- PhD candidate in the Department of Health Policy at LSE.
- Studies how people form health-related behaviours during crises, from vaccination intentions to preventative care.
- Background in econometrics, causal inference, and computational economics.
- Has taught machine learning courses at the LSE Data Science Institute.
- Runs the afternoon labs.
📲 Who’s here?
10:20 – 10:50

Scan the QR code or go to menti.com
Keep Menti open throughout this section!
We will run through a set of quick questions so I can see who is in the room, what you know, and what tools you have used.
The mythical data science unicorn 🦄

knows everything about statistics
able to communicate insights perfectly
fully understands businesses like no one
is a fluent computer programmer
In reality…
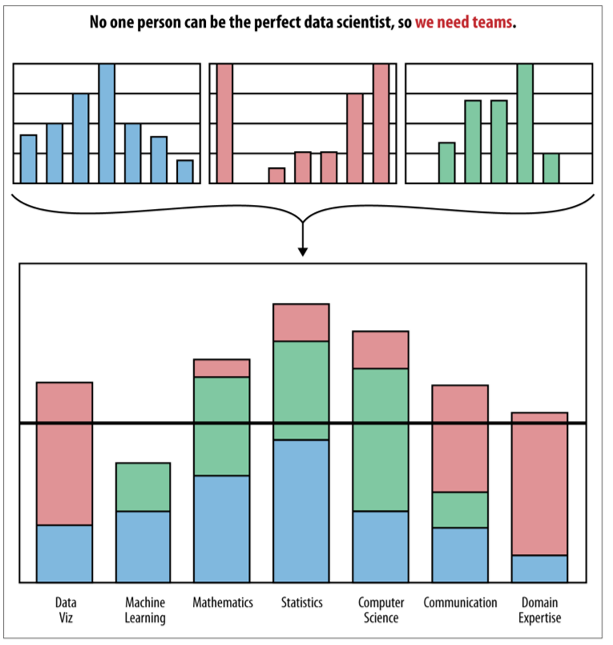
We are all jugglers 🤹
- Everyone brings a different skill set.
- We need multi-disciplinary teams.
- Good data scientists know a bit of everything.
- Not fluent in all things
- They know when and where to work with others
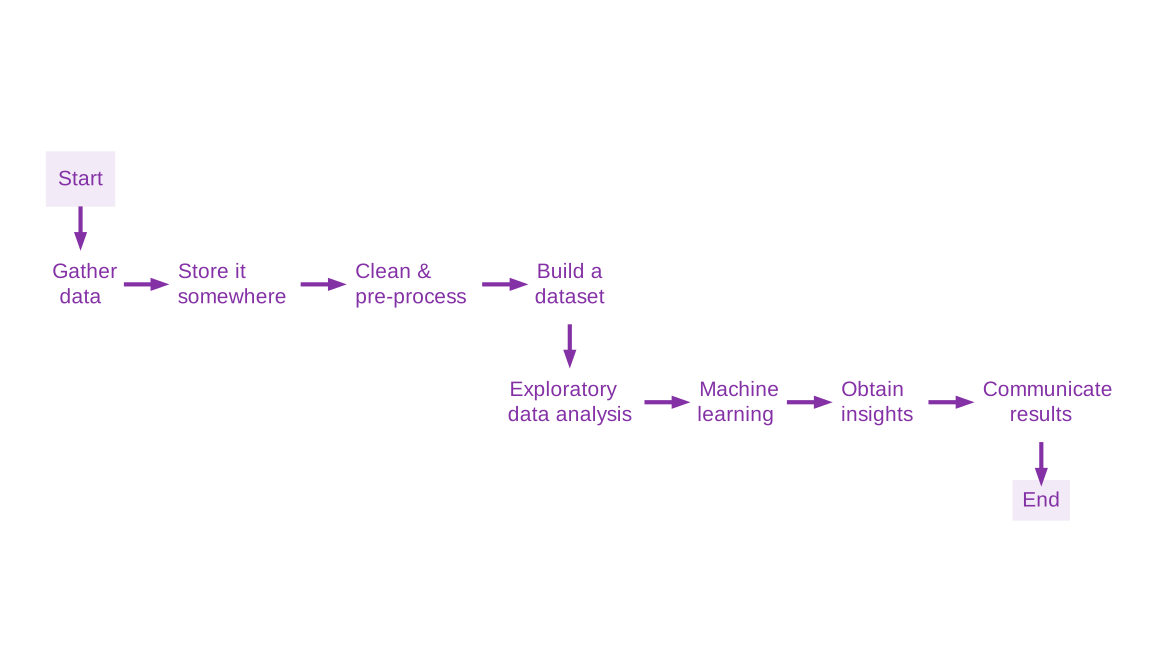
The Data Science Workflow
The Data Science Workflow (of this course)
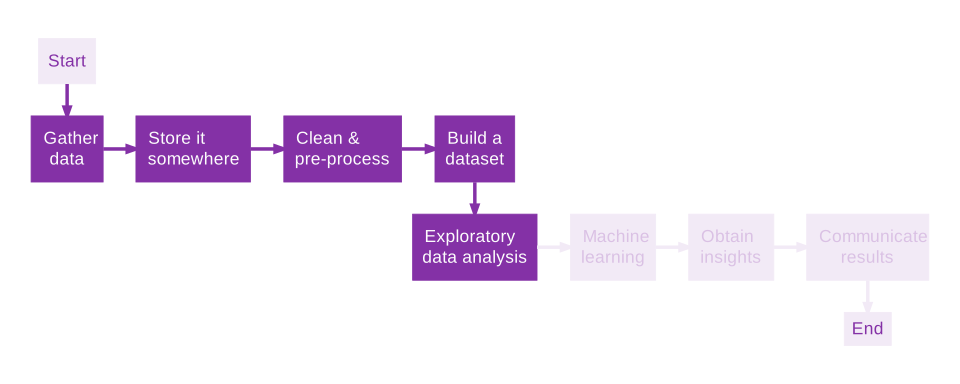
People in the field like to joke that 80% of the time and effort spent on a data science project goes to the tasks highlighted in the diagram above.
And this is what this course is about! You will learn some of the most common tools used during this data wrangling process.
The meme is real
The struggle is real.
by u/ali_azg in r/dataengineering
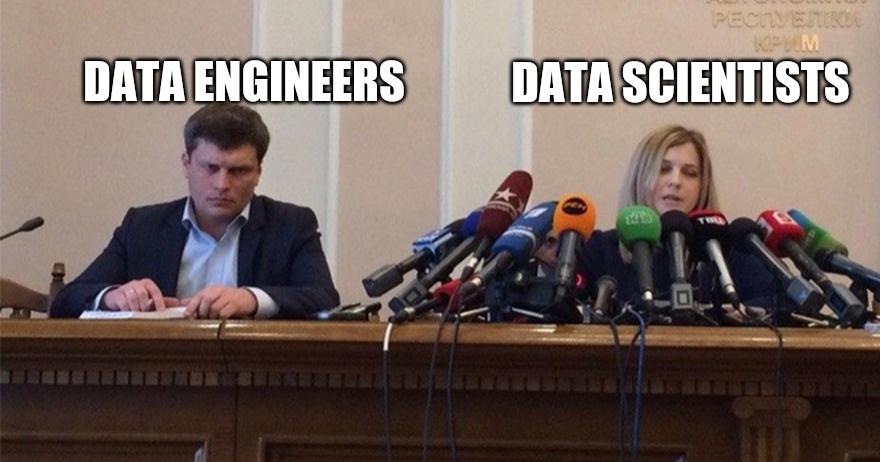
Preparing data for analysis doesn’t get as much attention as algorithms (what people usually think of when they hear the term data science), but it is an essential skill if you want to work with data.
Before This Course, You Already…
This course assumes some basic coding exposure:
- Know what variables are and how to create them
- Understand the different data types (
str,int,float,bool) - Know how to use conditionals (
if,elif,else) - Know how to use loops (
forandwhile) - Know how to use functions (
def) - Have an intuition for lists and dictionaries
Complete beginners have done well in this course before. Expect a steep first week if you are starting from scratch.
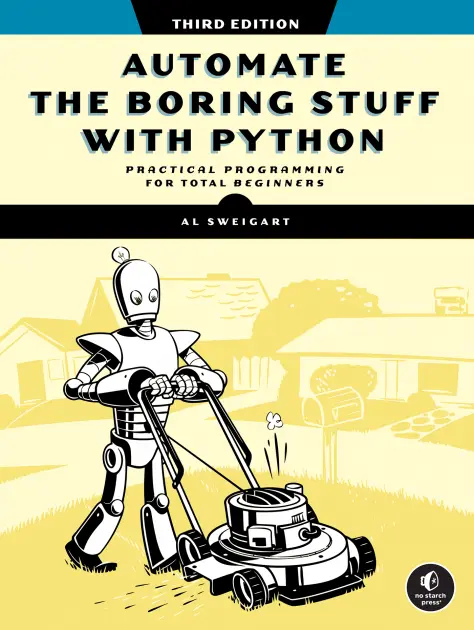
📗 Automate the Boring Stuff, chapters 1 to 5
Course syllabus

Let’s look at the course syllabus together:
📔 Syllabus
Everything you need is on Moodle, but we also have a website anyone can open so you can refer to it even after the course is over:
☕ Coffee Break
11:35 – 11:50

When we come back:
- You ask an AI to answer a real data question
- We compare your AI’s answer to the audited ground truth
- What I have learned from watching students use AI to learn
- How AI fits into your work in this course
The Ground Truth
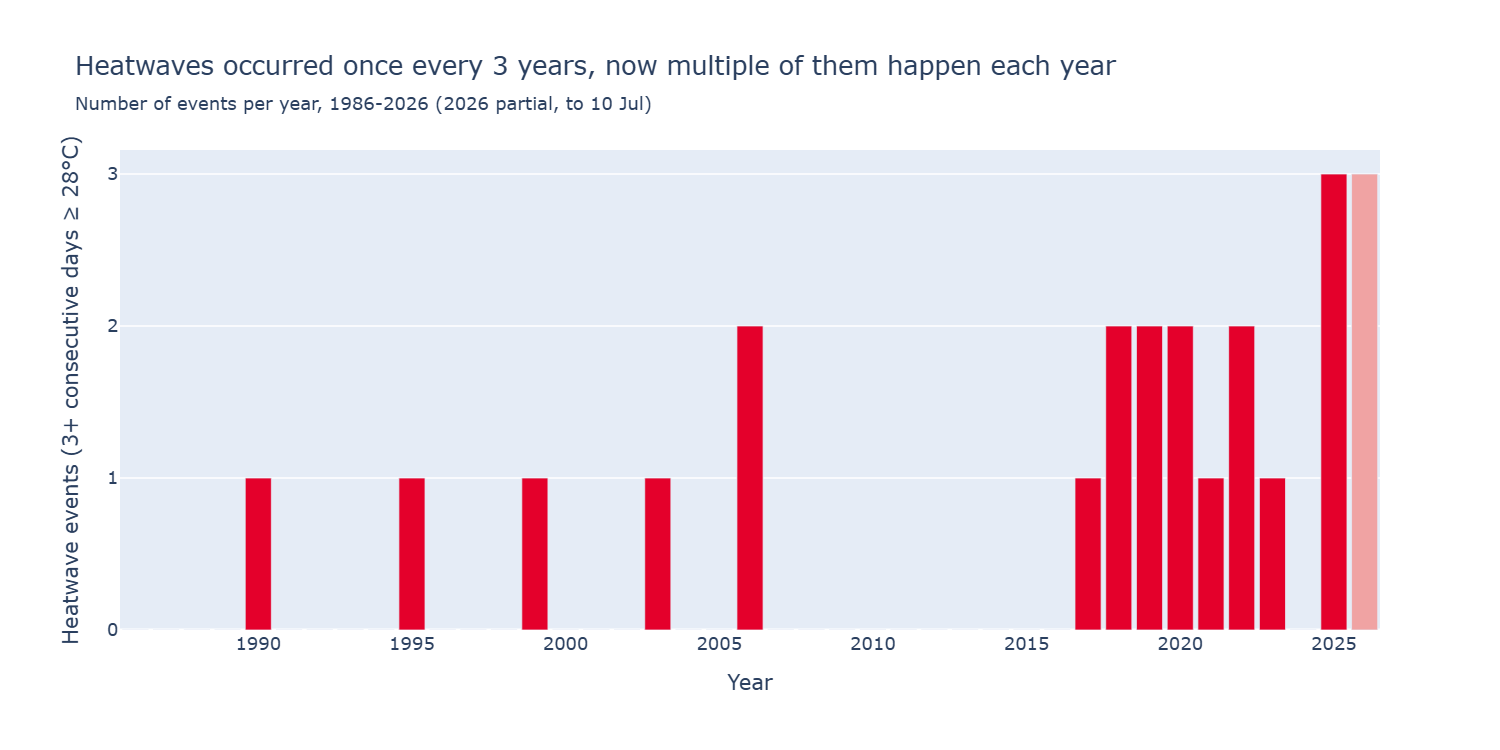
Data source:  Open-Meteo Historical Weather API (ERA5 reanalysis). Definition: 3+ consecutive days at or above 28°C (London’s Met Office threshold). Each event is one unbroken run of 3+ days. Period: 1986 to 10 Jul 2026.
Cognitive offloading, in one picture
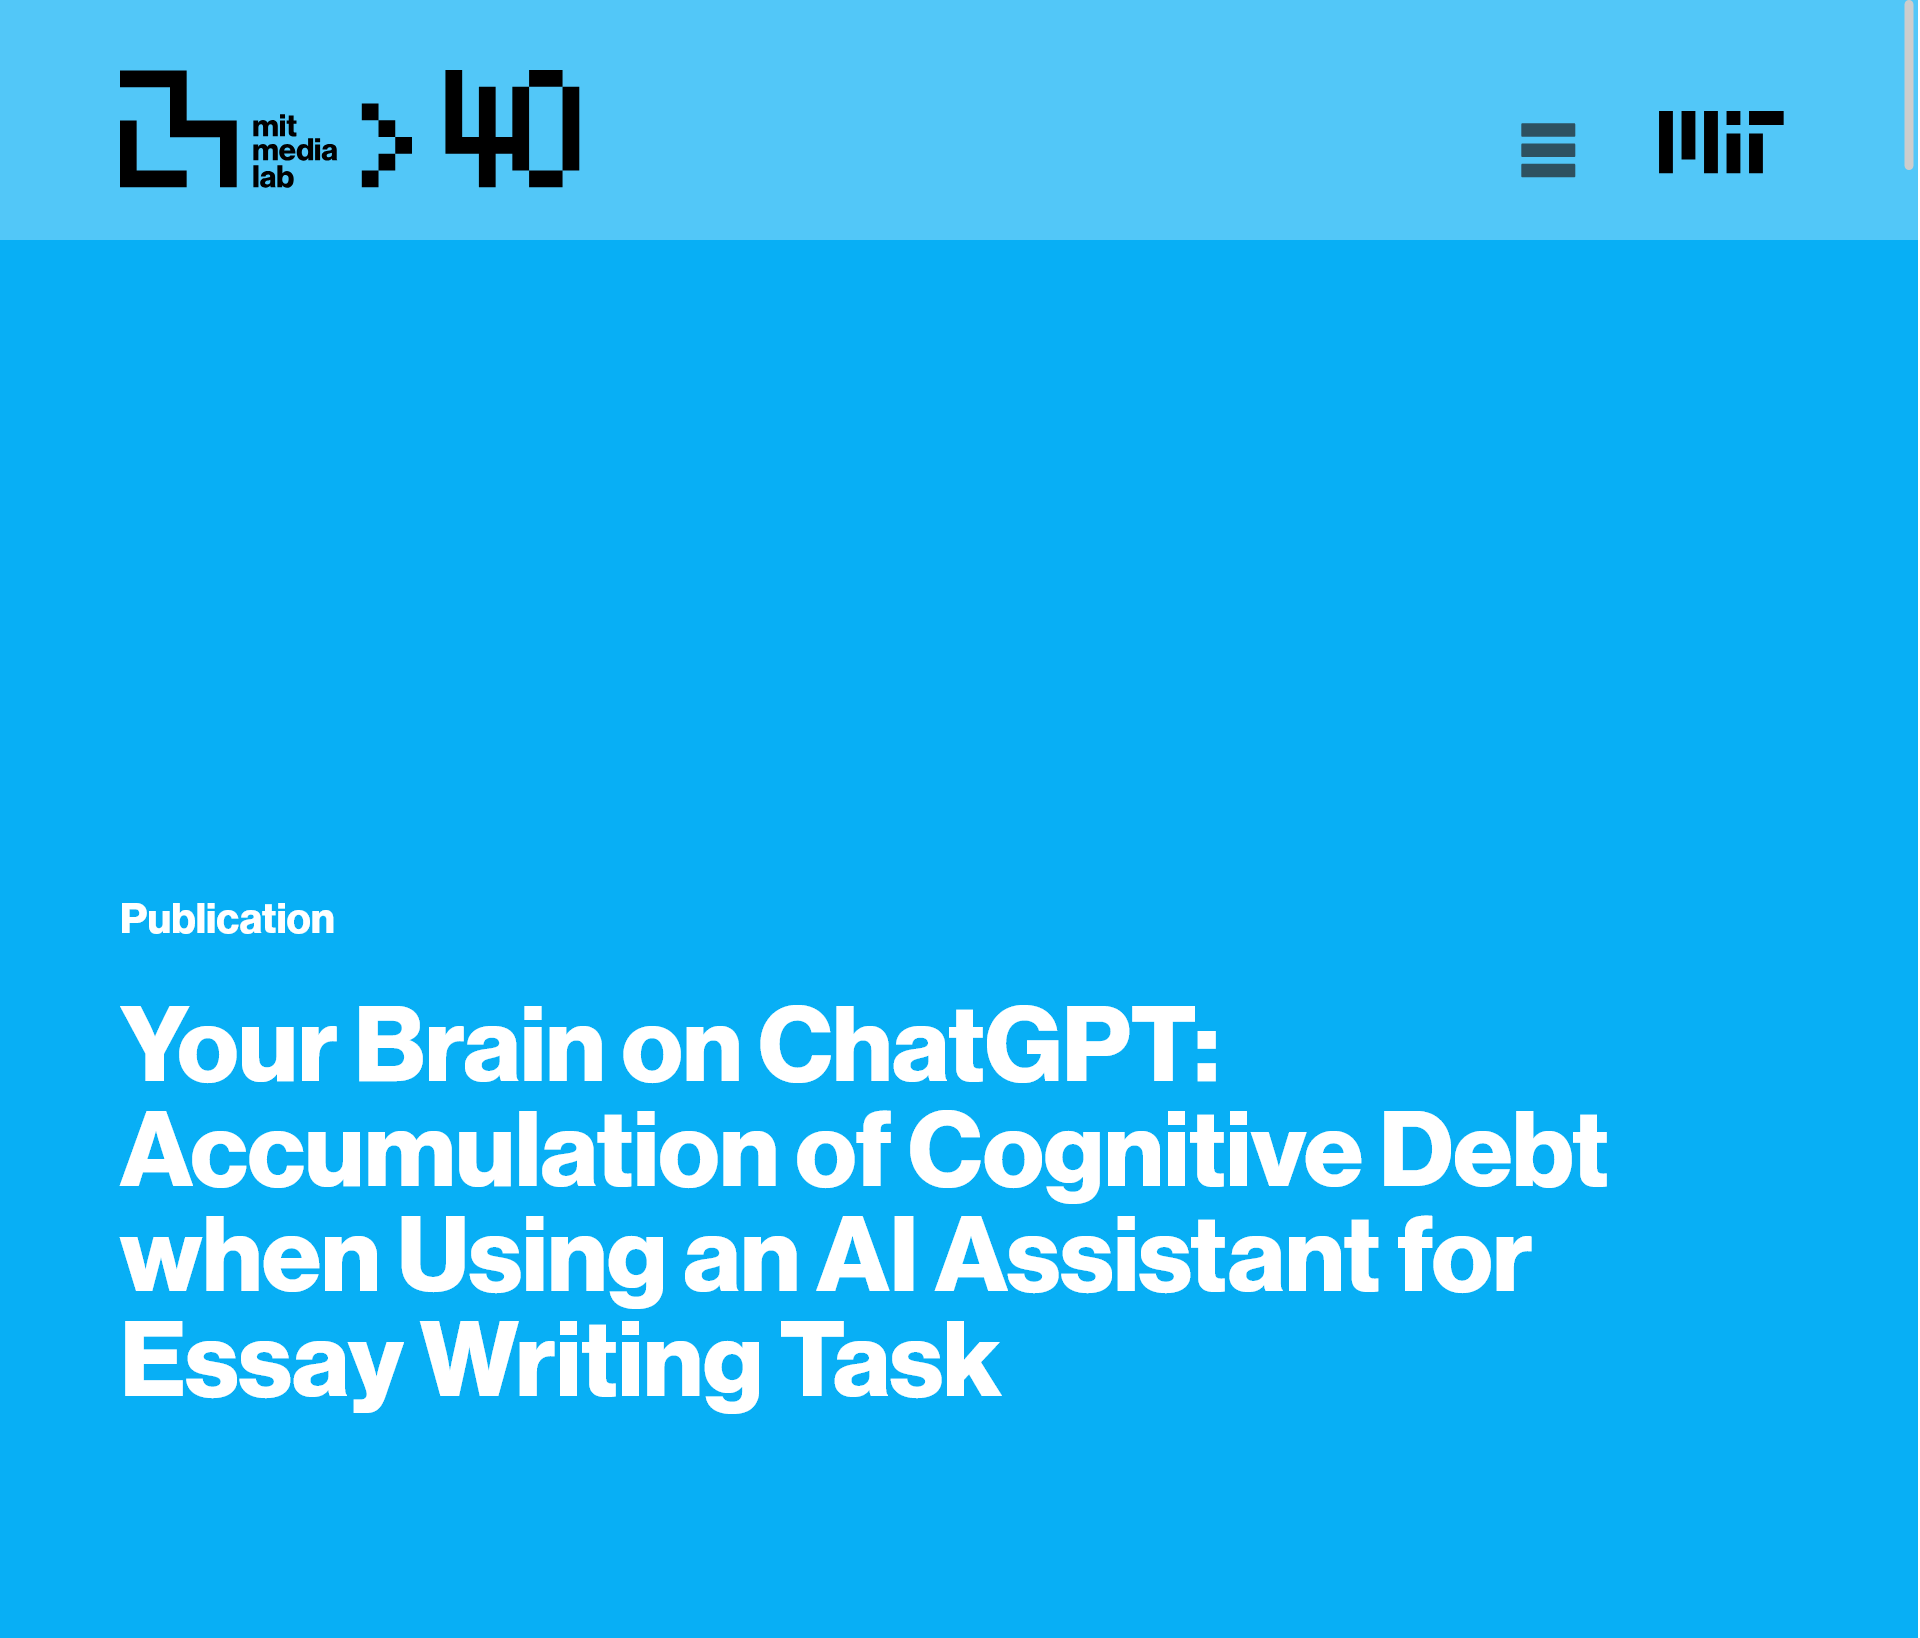
Kosmyna et al. (2025), MIT Media Lab
Confident answers ≠ correct data work.
The studies say the same thing in different words:
- practice can go up while unaided performance falls
- polished output can hide missing knowledge
- who does the thinking matters
- quiz scores that look strong right after the lab can look ordinary three weeks later
For ME204: attempt → then AI to check or debug → keep only what you can justify.
5️⃣ This Afternoon
12:40 – 12:50
This afternoon’s lab
You will work with just the Terminal and tomorrow we will discuss your experience.
You will learn how to use your keyboard to do things you’d normally do with a mouse:
pwd(see where you are in your computer),ls(view the list of files),cd(change directory), andcat(check the content of a text file).
By 💻 Week 01 Day 03 Lab you will use the terminal to fetch the same weather data you just asked an AI to find. By 💻 Week 01 Day 04 Lab you will have it in a table.
This is what it looks like
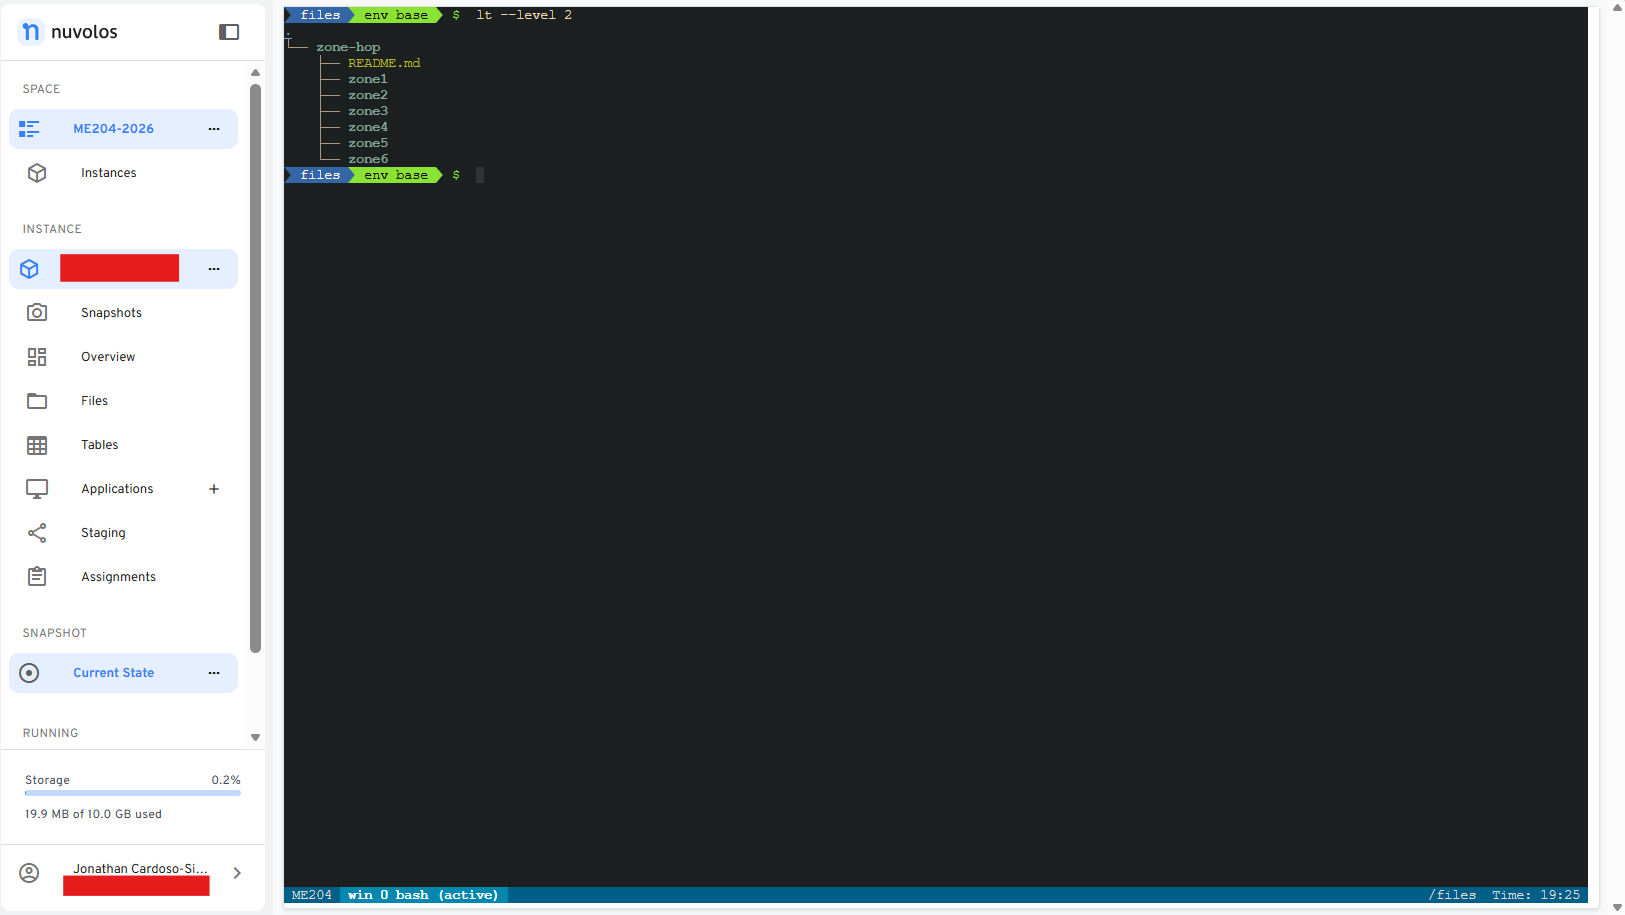
Whether or not you have seen a terminal before, you start from the same place this afternoon: four commands and a folder tree.
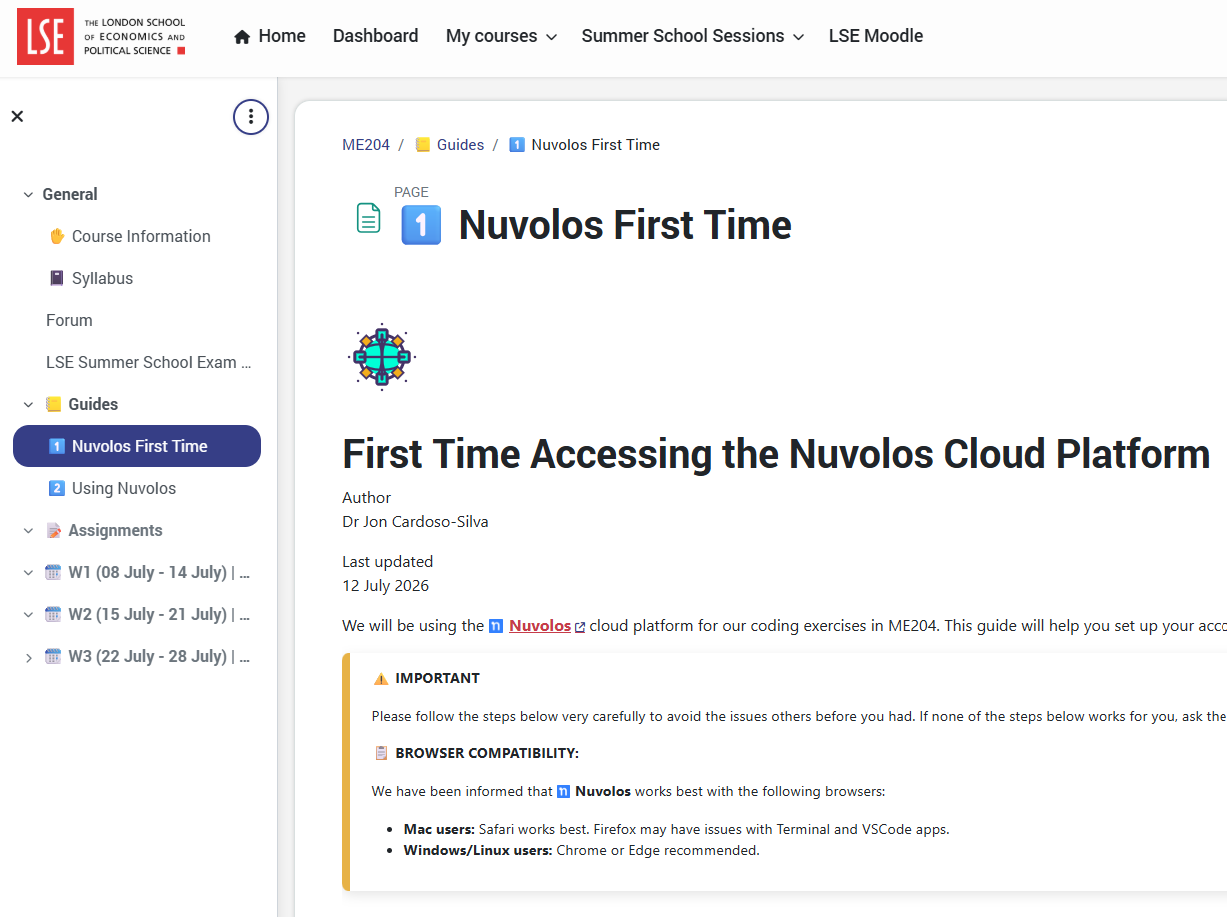
Let’s get set up on Nuvolos
We have a cloud environment called Nuvolos that has been set up for you to use during these 3 weeks of ME204.
The step-by-step guide is on Moodle: Guides → 1 Nuvolos First Time.
Thanks!
12:50
This afternoon: your first terminal session with Jonas.
💬 Keep notes about anything you may not have understood so we can sort out your questions tomorrow morning!
References
These slides were built with Quarto.
- Shah, C. (2020). A hands-on introduction to data science. Cambridge University Press.
- Schutt, R., & O’Neil, C. (2013). Doing data science (1st edition). O’Reilly Media.
- Heatwave data: Open-Meteo Historical Weather API (ERA5 reanalysis), 1986 to 10 July 2026.
- Sweigart, A. (2019). Automate the Boring Stuff with Python (2nd edition). No Starch Press.
- Bastani, H., Bastani, O., Sungu, A., Ge, H., Kabakcı, Ö., & Mariman, R. (2025). Generative AI without guardrails can harm learning. Proceedings of the National Academy of Sciences, 122(26).
- Fan, Y., Tang, L., Le, H., Shen, K., Tan, S., Zhao, Y., Shen, Y., Li, X., & Gašević, D. (2025). Beware of metacognitive laziness. British Journal of Educational Technology, 56(2), 489–530.
- Kosmyna, N., Hauptmann, E., Yuan, Y. T., Situ, J., Liao, X.-H., Beresnitzky, A. V., Braunstein, I., & Maes, P. (2025). Your Brain on ChatGPT. arXiv:2506.08872.
- Akgün, M., & Toker, S. (2025). Short-Term Gains, Long-Term Gaps: The Impact of GenAI and Search Technologies on Retention. arXiv:2507.07357.
LSE Summer School 2026 | ME204 Week 01 Day 01