🗓️ Week 01 – Day 01
Introduction
10 Jul 2023
Who we are: your lecturer

Assistant Professor of Data Science (Education)
LSE Data Science Institute
🌐 jonjoncardoso.github.io

nlp
text mining
optimisation
data science workflow
relationship-rich education
generative AI for education
machine learning applications
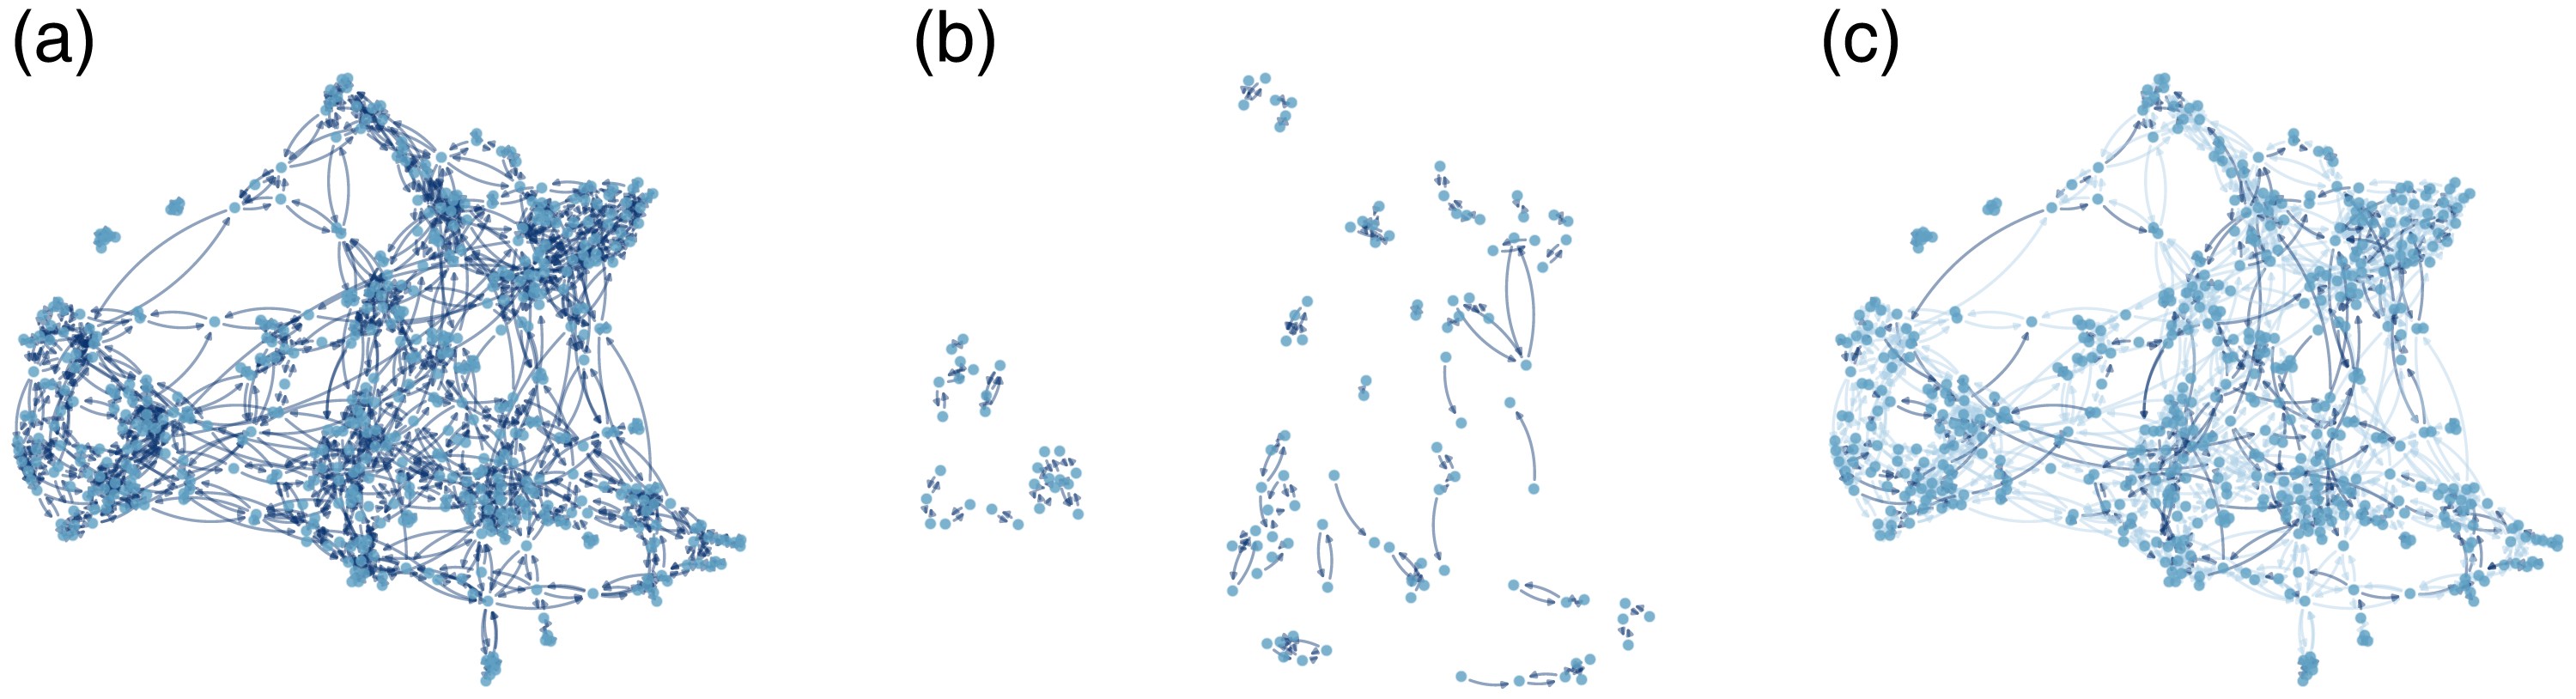
Recent projects: VIMuRe

VIMuRe (social network analysis)
📦 Python and R packages available
De Bacco, Caterina, Martina Contisciani, Jonathan Cardoso-Silva, Hadiseh Safdari, Gabriela Lima Borges, Diego Baptista, Tracy Sweet, et al. 2023. “Latent Network Models to Account for Noisy, Multiply Reported Social Network Data.” Journal of the Royal Statistical Society Series A: Statistics in Society, February, qnac004.
We developed a Bayesian statistical model to uncover the ‘true’ underlying network behind the social network ties reported by individuals.
- This is applied to a type of tie elicitation called double-sampling.
- The model can detect when a person has the tendency to under- or over-reported their ties.
- among other things…
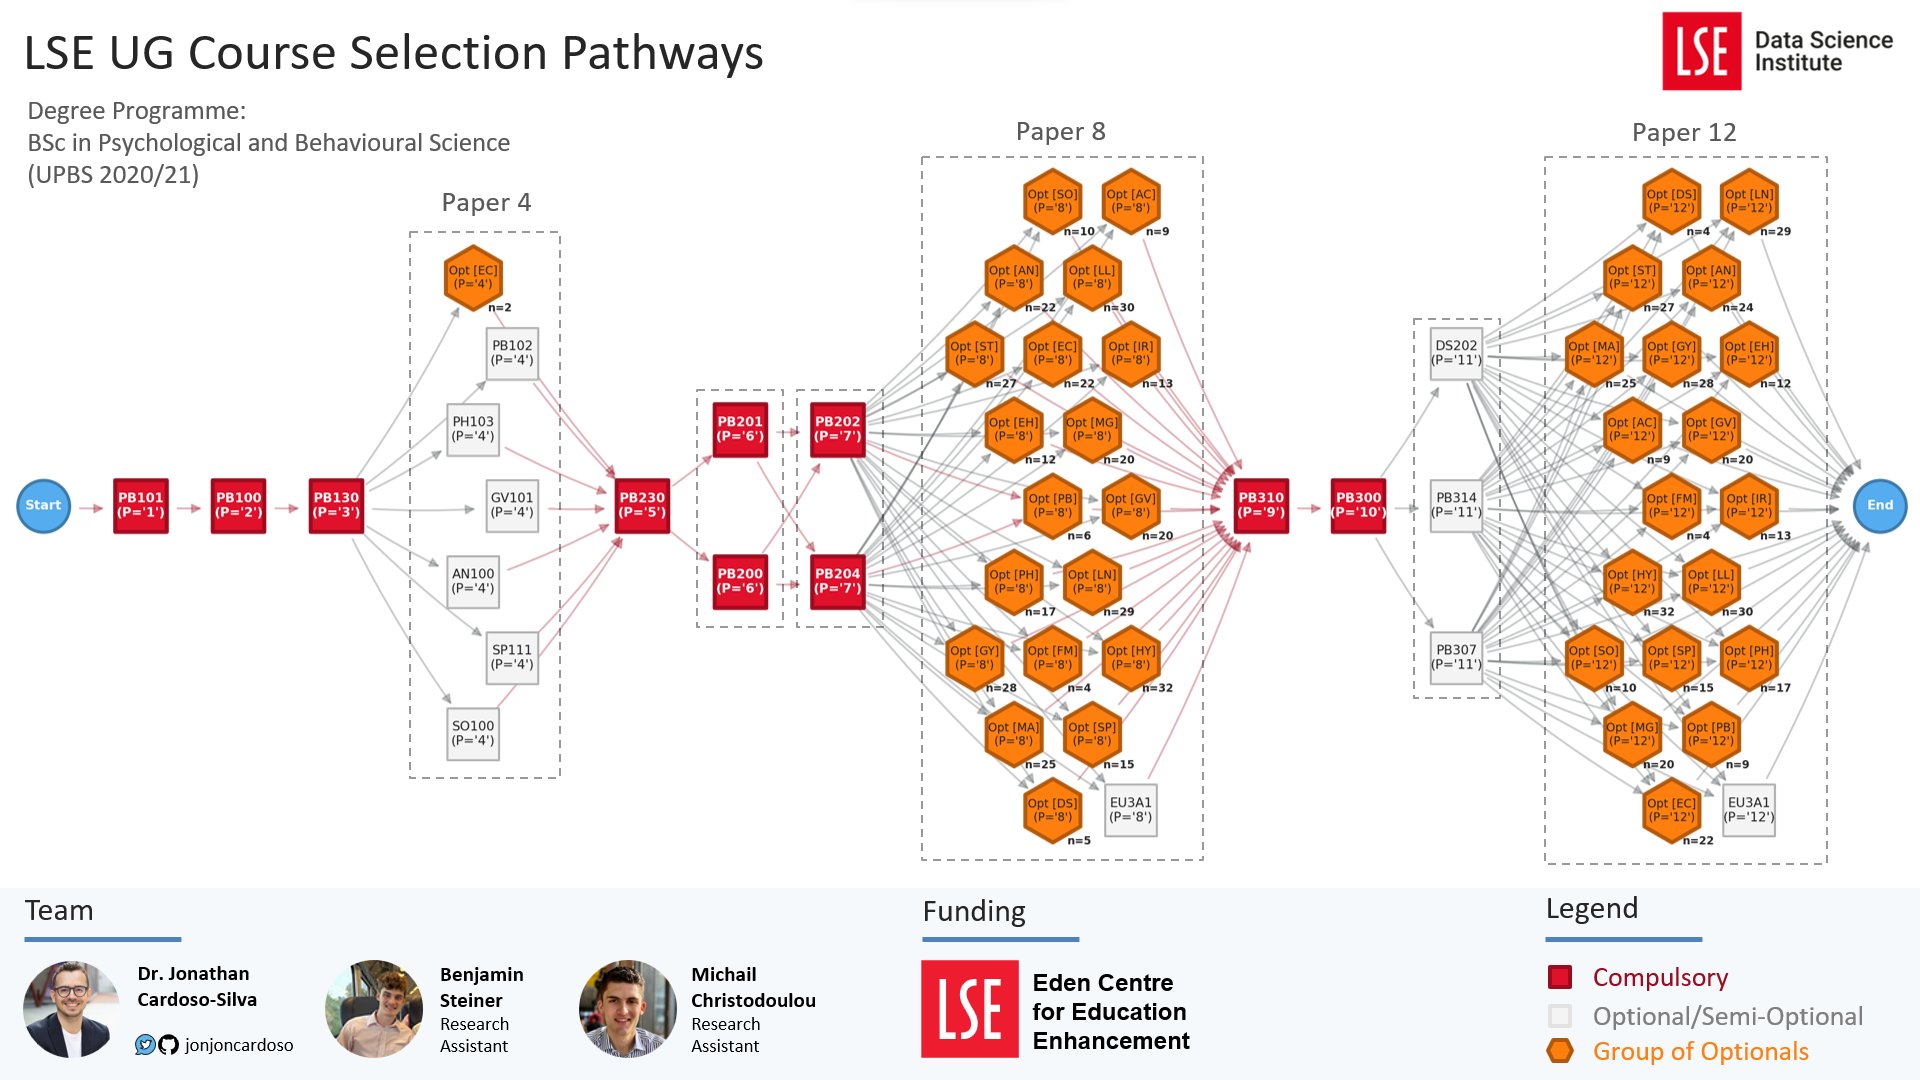
Recent projects: LSE Course Selection Pathways
Recent projects: Emojis and Political Identities
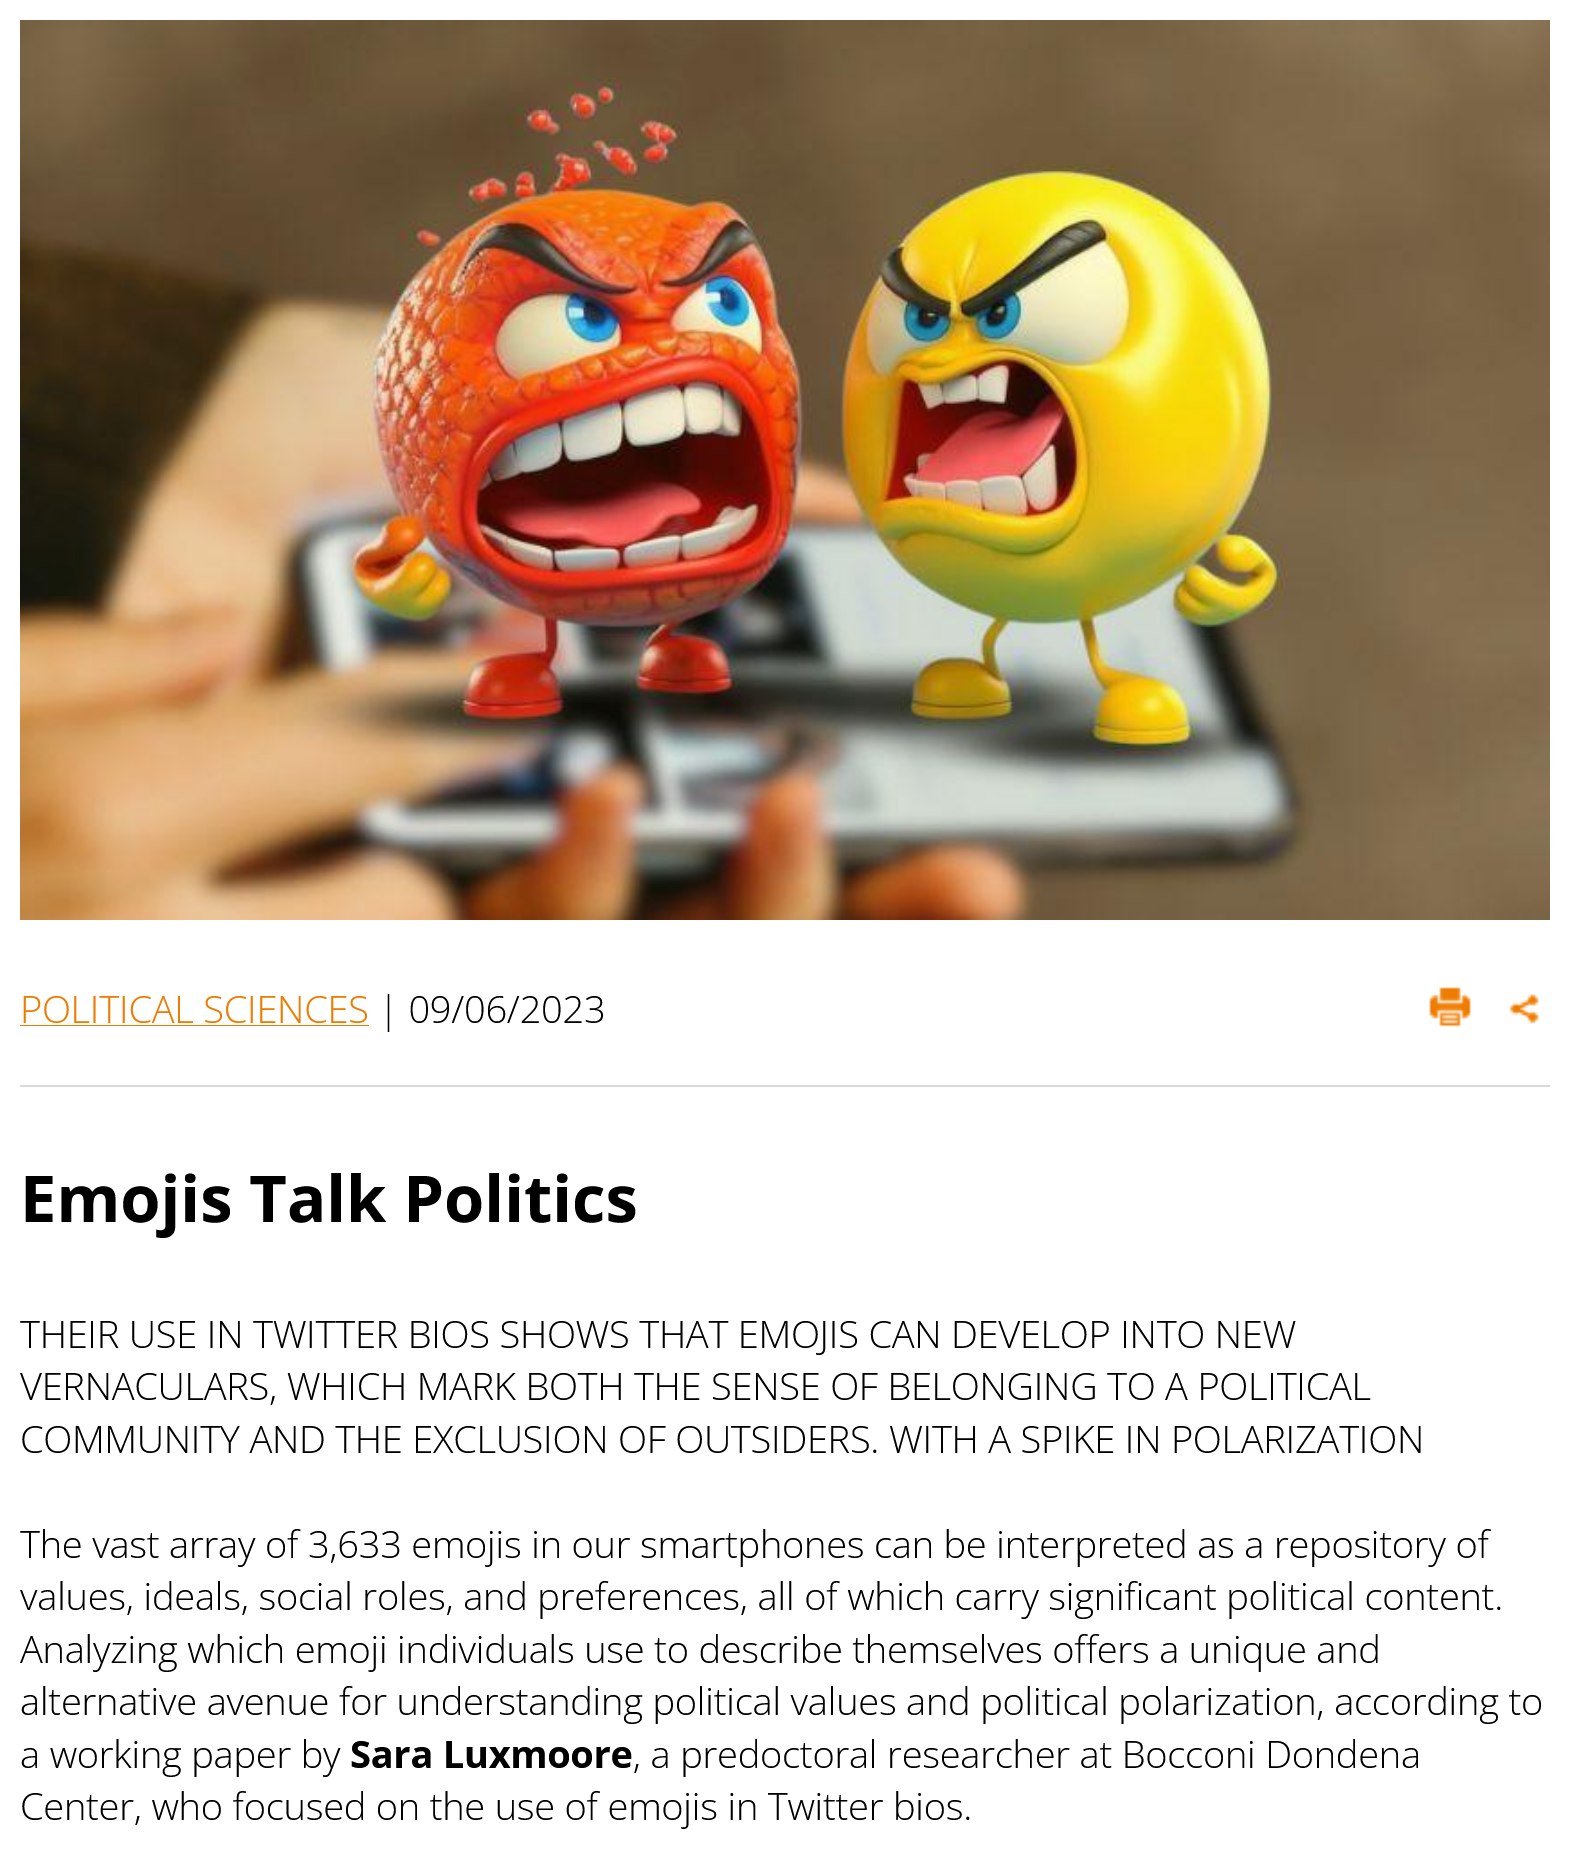
What can the emojis you use in your social media profile reveal about your political values? 🤔
Collaboration with:
- Sara Luxmoore* (Incoming PhD student at UC Berkeley)
- Pedro Ramaciotti (Research Scientist @ médialab Sciences Po)
Recent Projects: Generative AI in Education
Joint project with Dr Marcos Barreto (LSE Statistics)
CONTEXT
In higher education, students are increasingly using Generative AI tools like ChatGPT, GitHub Copilot, Bard, Bing AI to enhance their learning experience. These tools offer personalised and immediate assistance for tasks such as summarising literature, brainstorming, and the writing of code and text, even though some outputs may have limitations in terms of transparency and accuracy. Some educators feel encouraged to incorporate these tools into our teaching and assessments to support students, but there is still limited evidence on how effective these generative AI tools are in improving learning outcomes.
This focus group aims to fill that gap and explore the practical applications of these tools and their role in enhancing, specifically, programming skills and critical thinking.
OBJECTIVES
- Surveying participants and the academic community for their experiences and expectations related to generative AI.
- Reviewing literature on generative AI tools in Education.
- Identifying suitable tools for data science/quantitative courses.
- Testing selected tools against reference examples and establishing assessment metrics.
- Implementing and validating case studies.
- Producing evidence to support peers and inform policy decisions
Who we are: your class teacher

PhD Candidate at LSE Mathematics
📧 m.dalirrooy-fard@lse.ac.uk
mathematics
graph theory
machine learning
software engineering
combinatorial optimisation
The Data Science Institute
- This course is offered by the LSE Data Science Institute (DSI).
- DSI is the hub for LSE’s interdisciplinary collaboration in data science
- ⏭️ Let’s see a few activities that might be of interest to you
CIVICA Seminar Series

How to get involved?
Sign up for the DSI Newsletter
Who are you?
The mythical unicorn 🦄

knows everything about statistics
able to communicate insights perfectly
fully understands businesses like no one
is a fluent computer programmer
In reality…
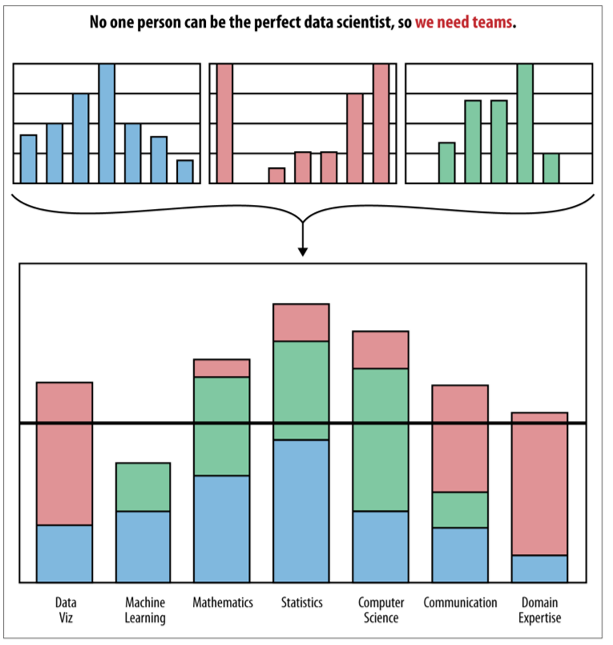
We are all jugglers 🤹
- Everyone brings a different skill set.
- We need multi-disciplinary teams.
- Good data scientists know a bit of everything.
- Not fluent in all things
- Understands their strenghts and weaknessess
- They know when and where to interface with others
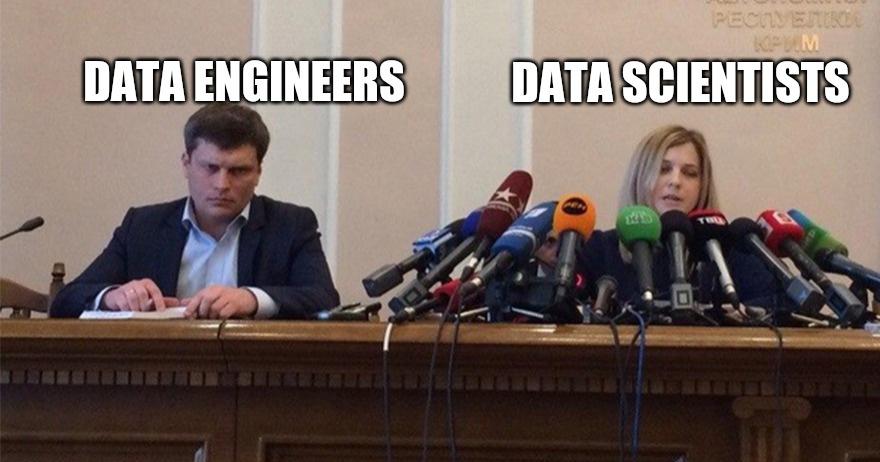
The meme is real
The struggle is real.
by u/ali_azg in r/dataengineering
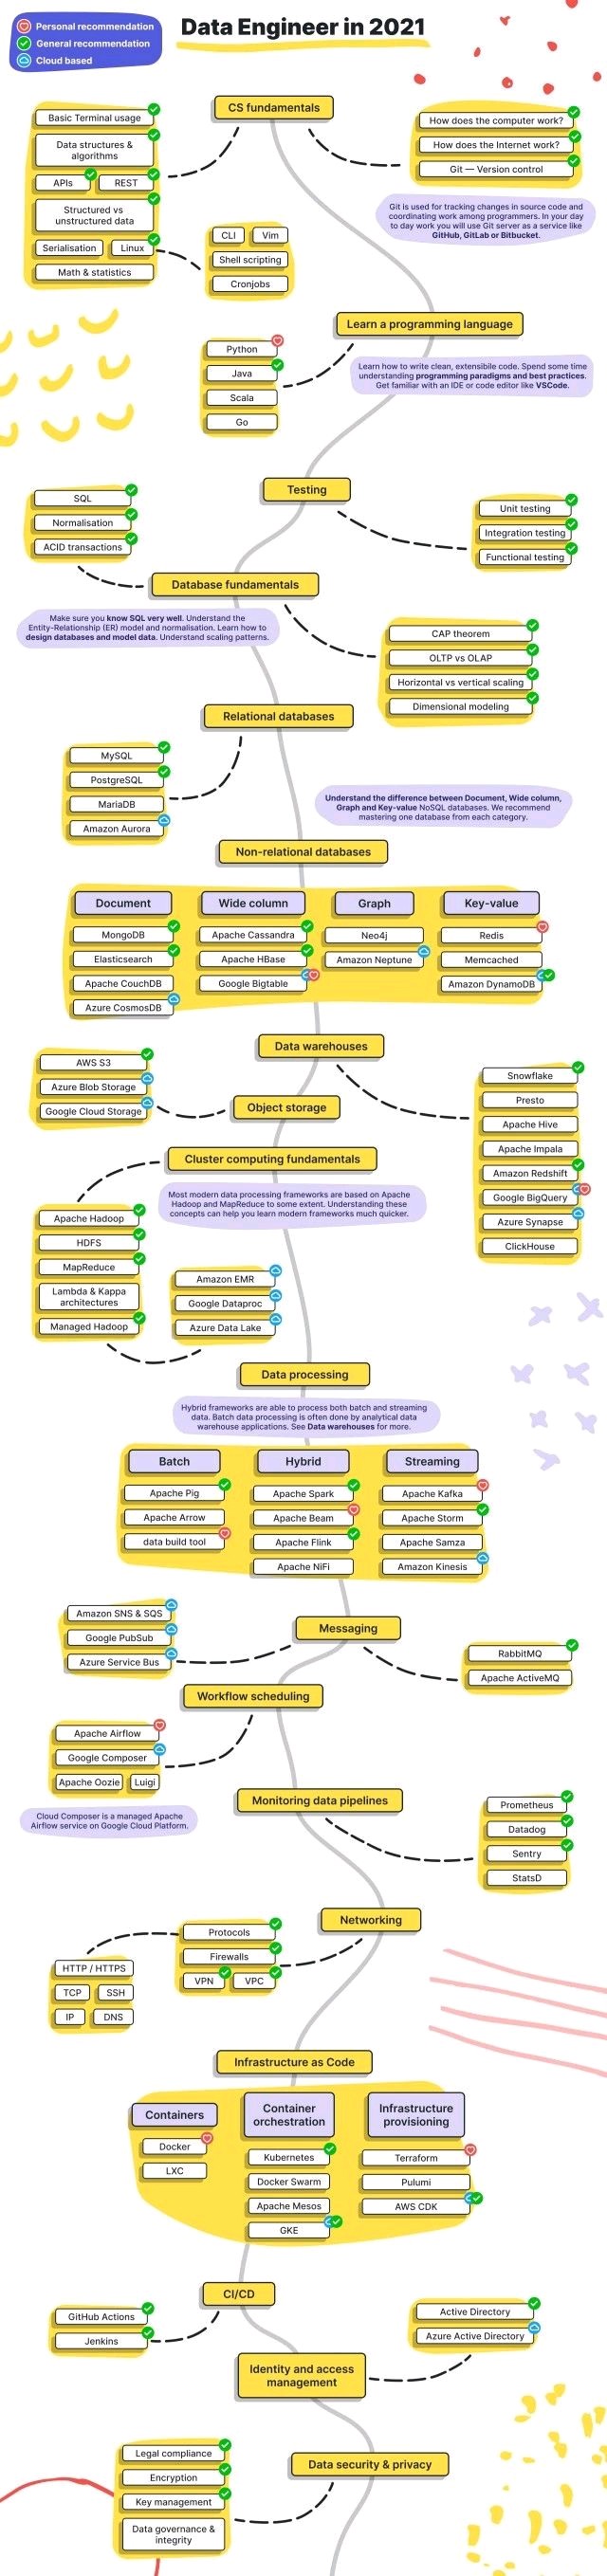
The field is vast
But remember the unicorn 🦄! You don’t need to be an expert in all of these tools.
![]()
DataEngineering 2021 in one pic
by u/Legitimate-Cry2837 in dataengineering
Let’s zoom in 🔎 here.
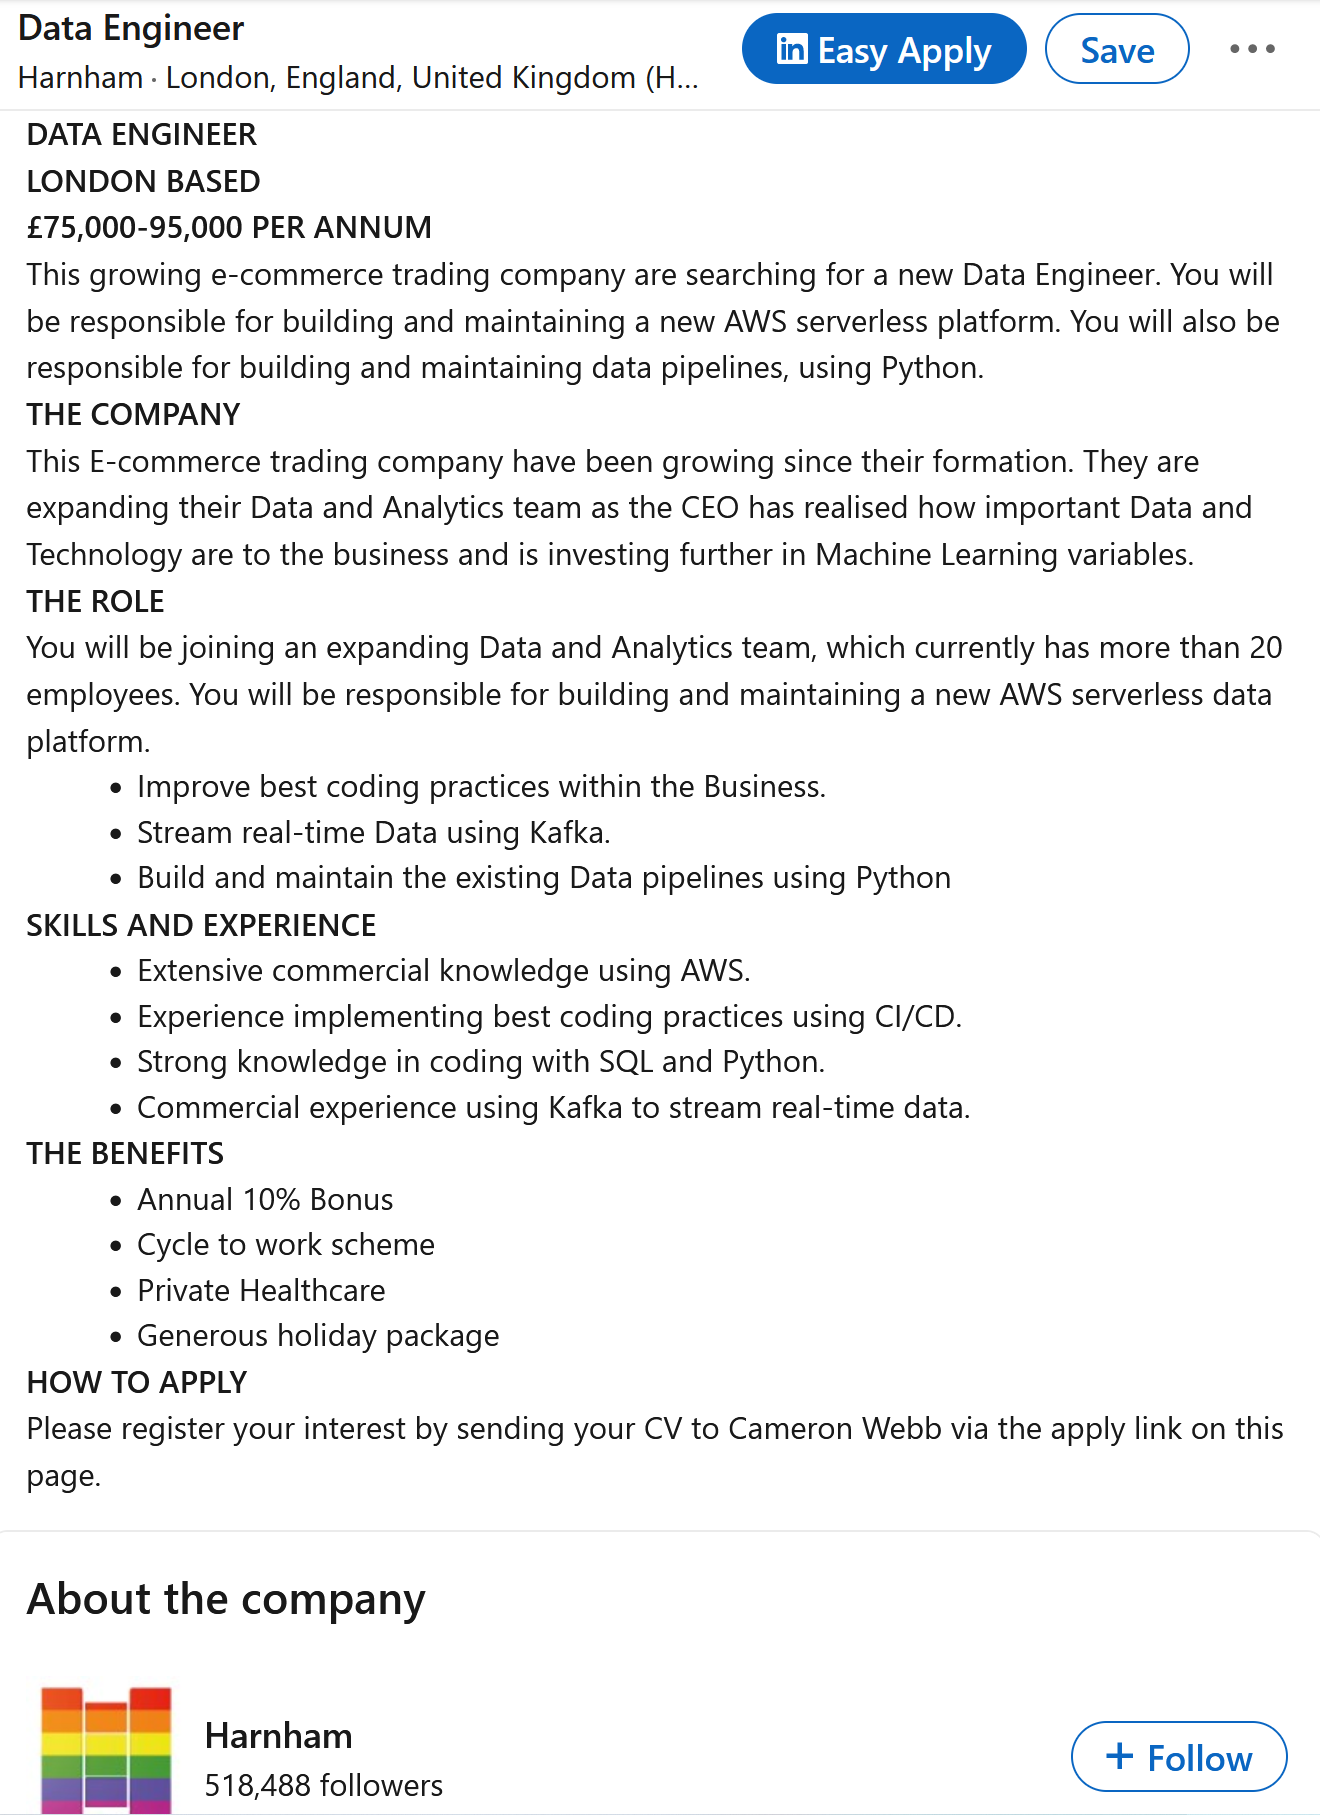
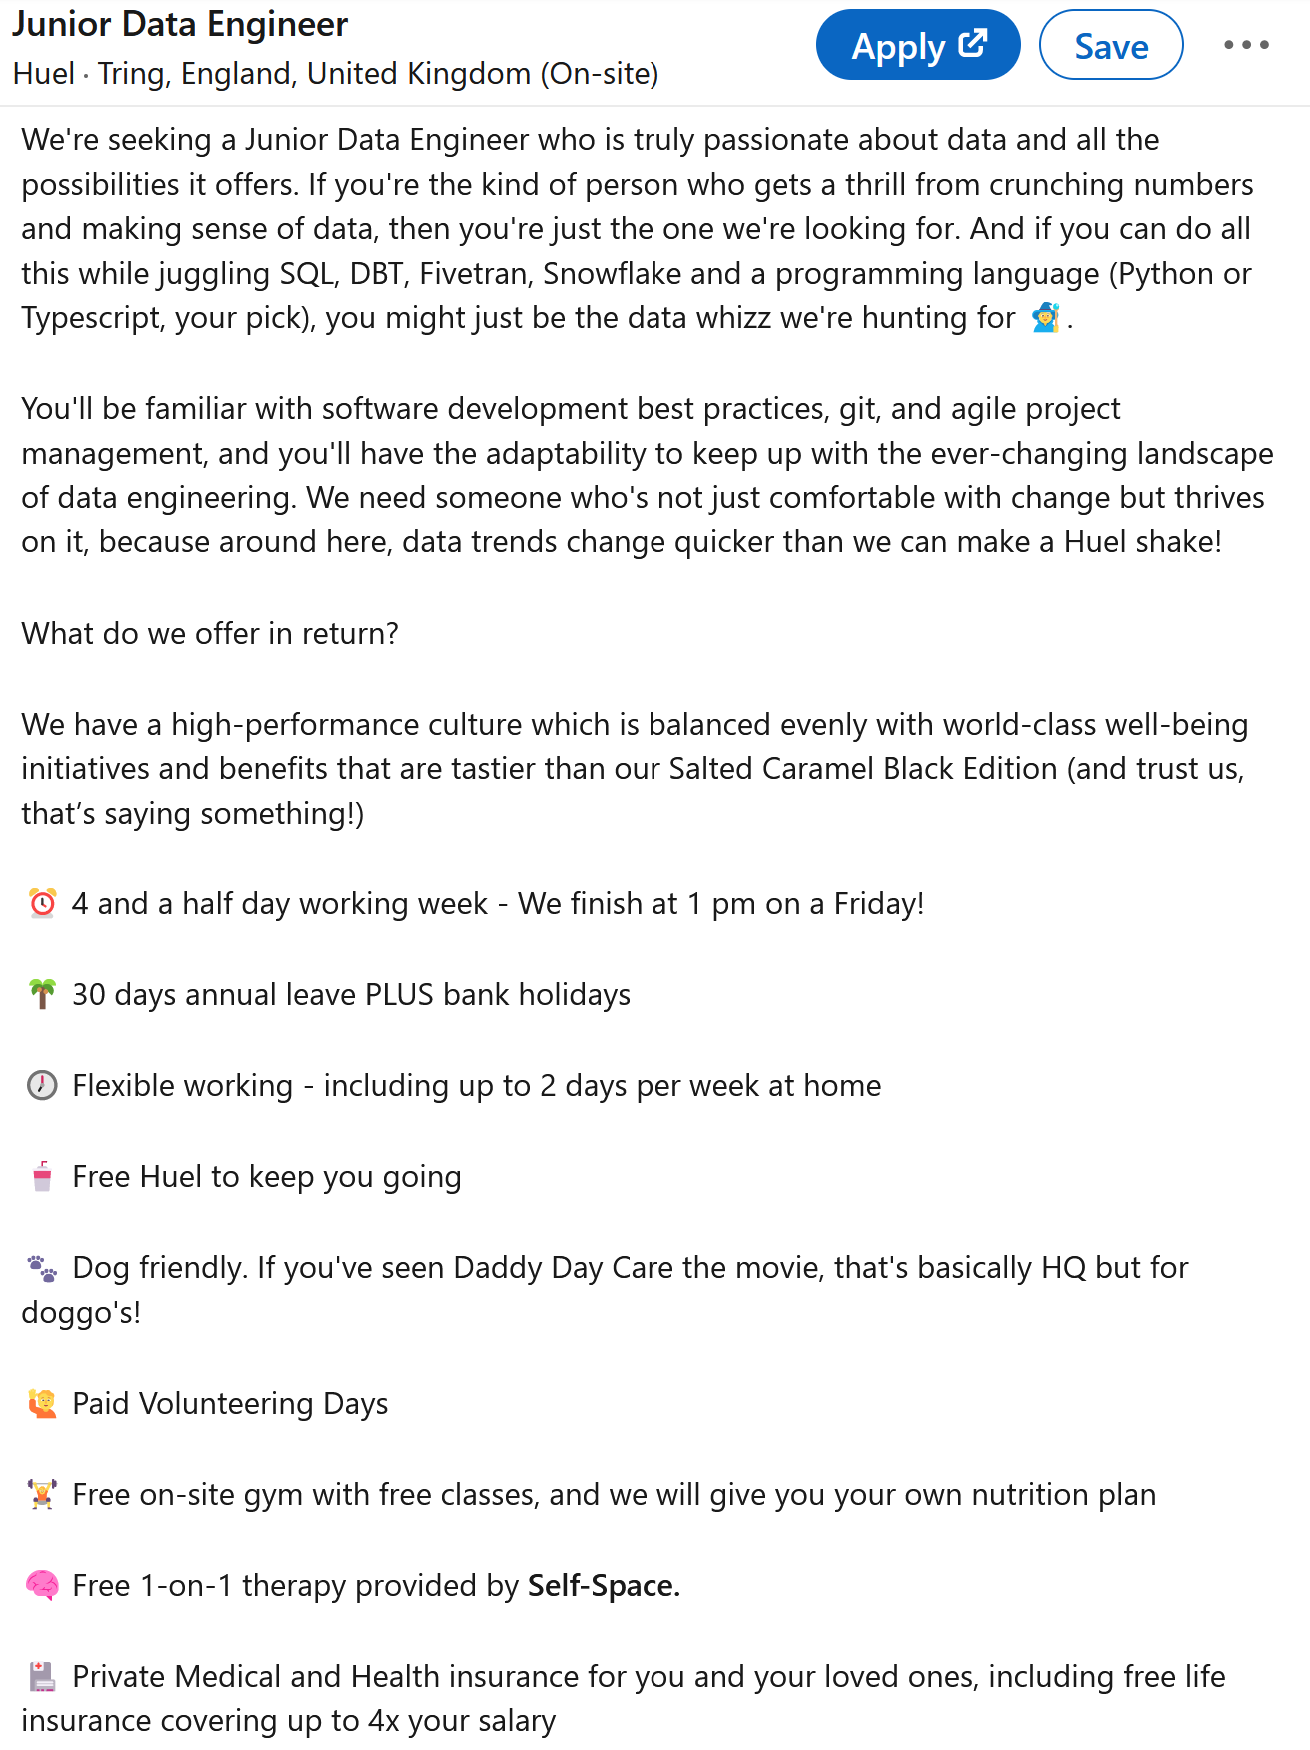
Data Engineer jobs - Part I
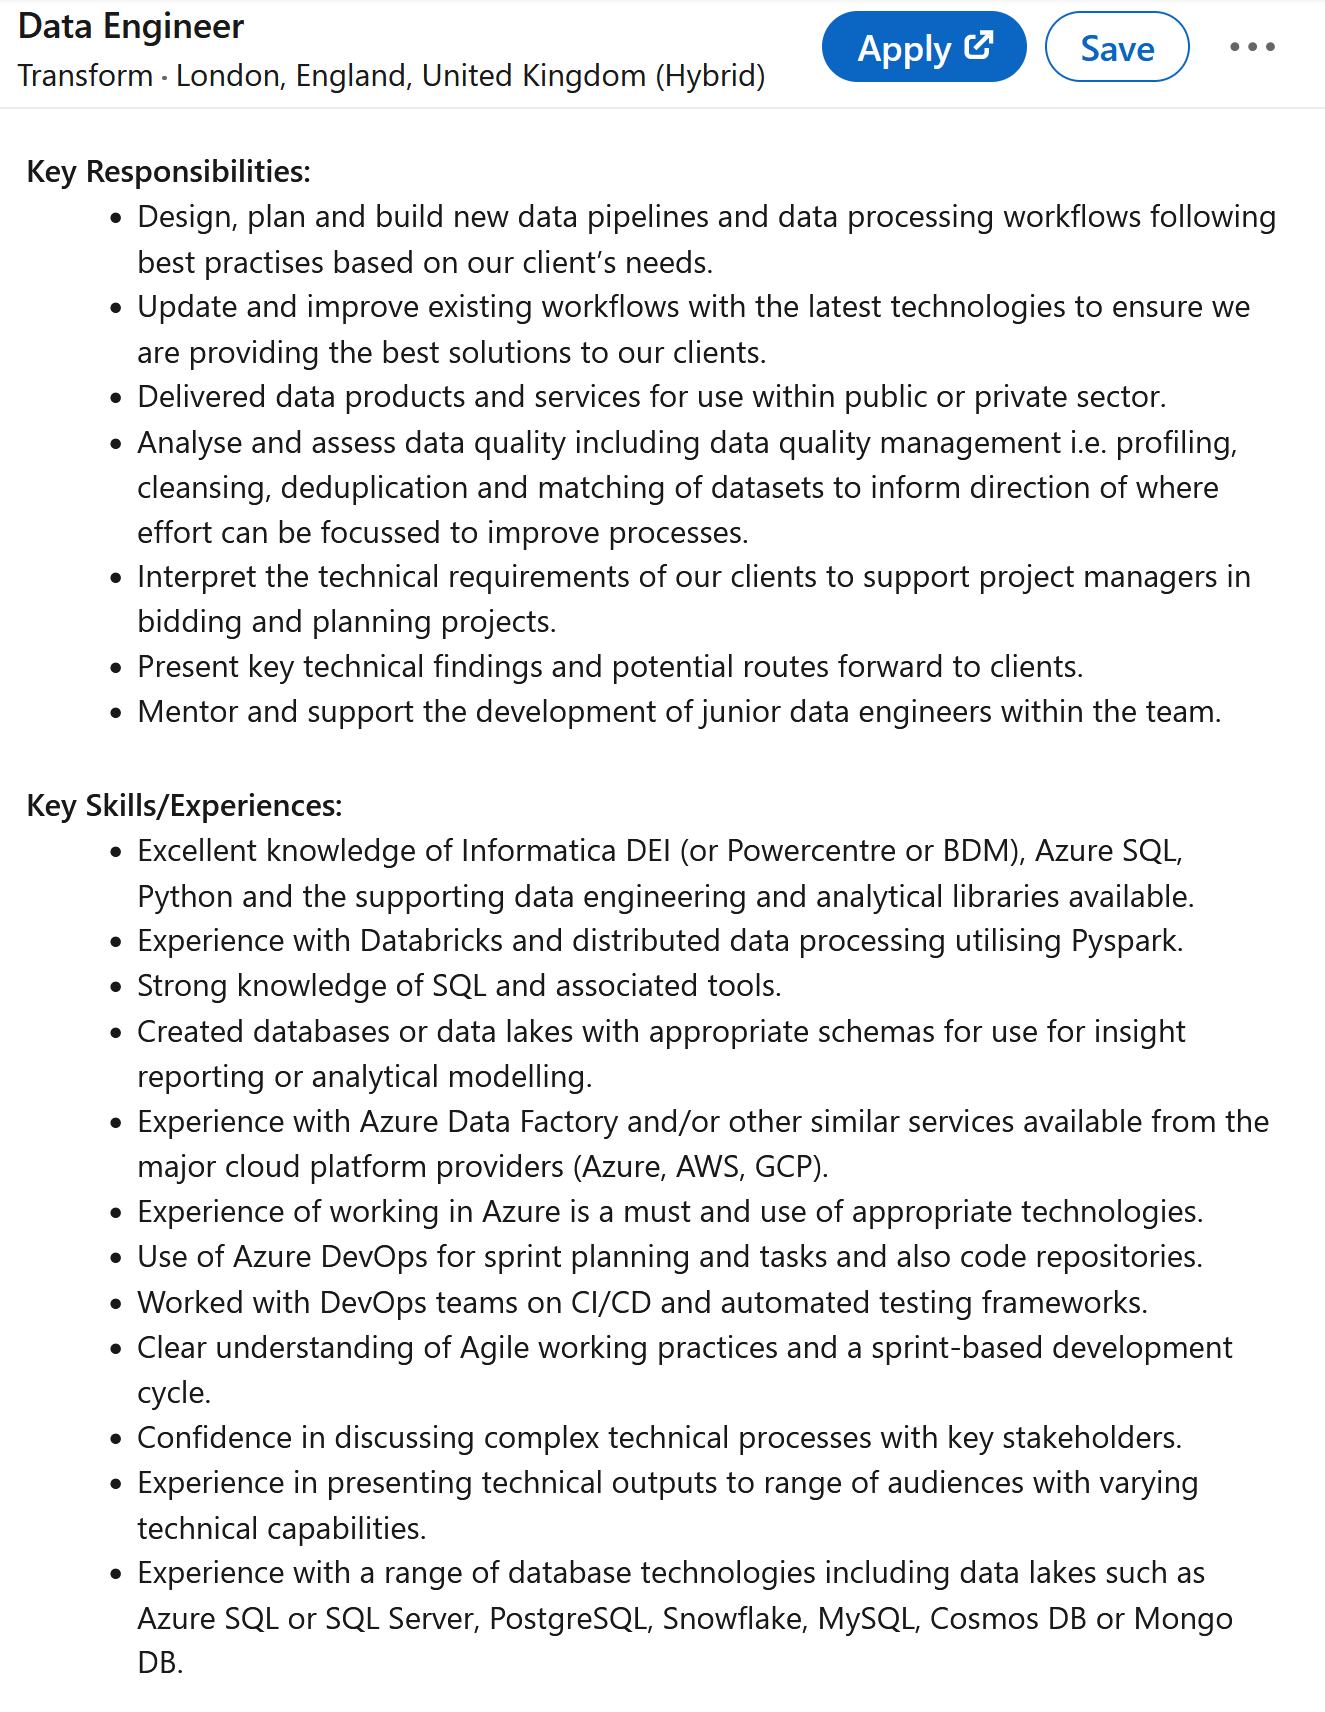
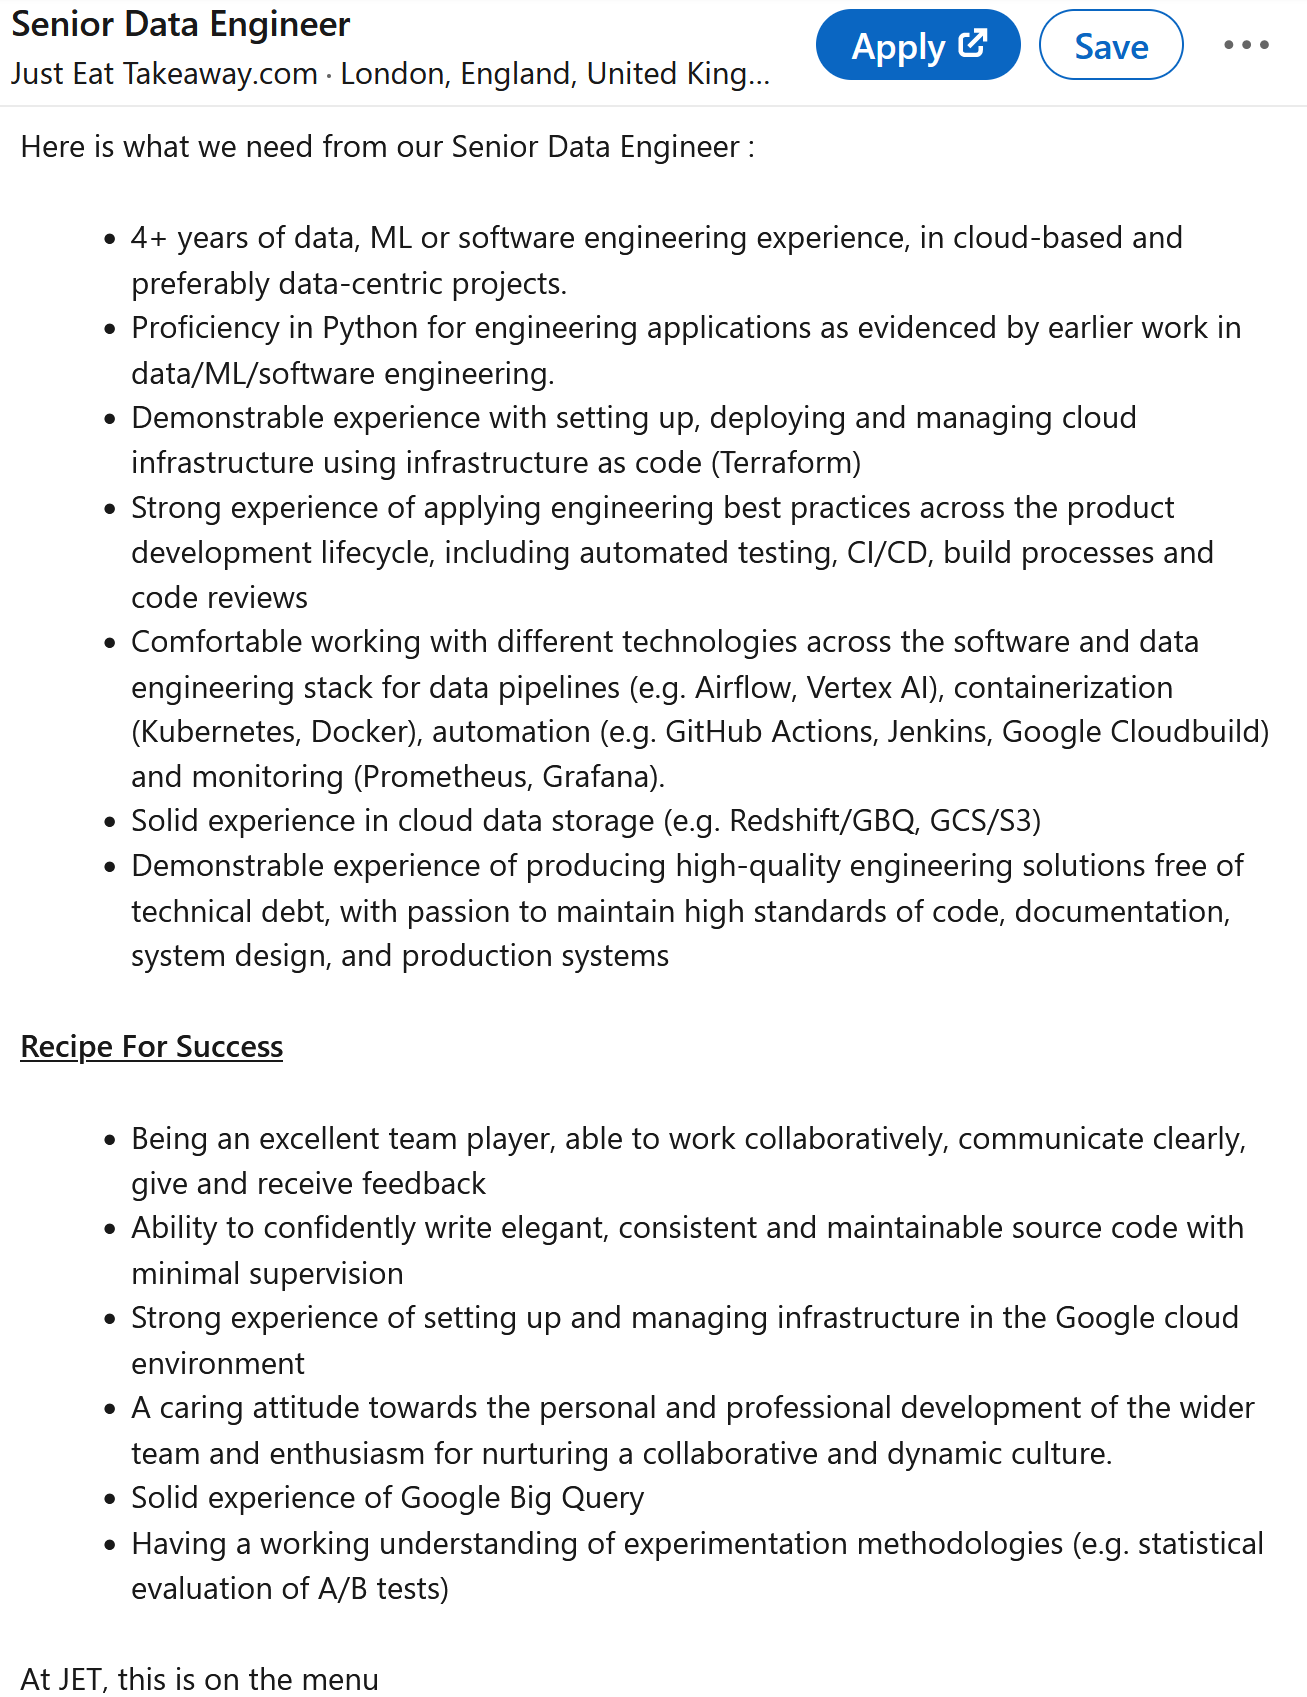
Data Engineer jobs - Part II
Course syllabus
![]()
Let’s navigate our website:
Time for coffee ☕

After the break:
- The toolbox 🧰 we will be using
- base R vs tidyverse
Python vs R
![]() Python
Python

How should we share code?
Github!
Use  Github for everything related to your project!
- You will learn to setup Github for your own code on 🗓️ Week 01 Day 03 lab.
Important
Don’t share code via e-mail, Dropbox, Google Drive, or anything like that!
It is a bad practice. Things get messy very quickly.
Software
The parts of an R function
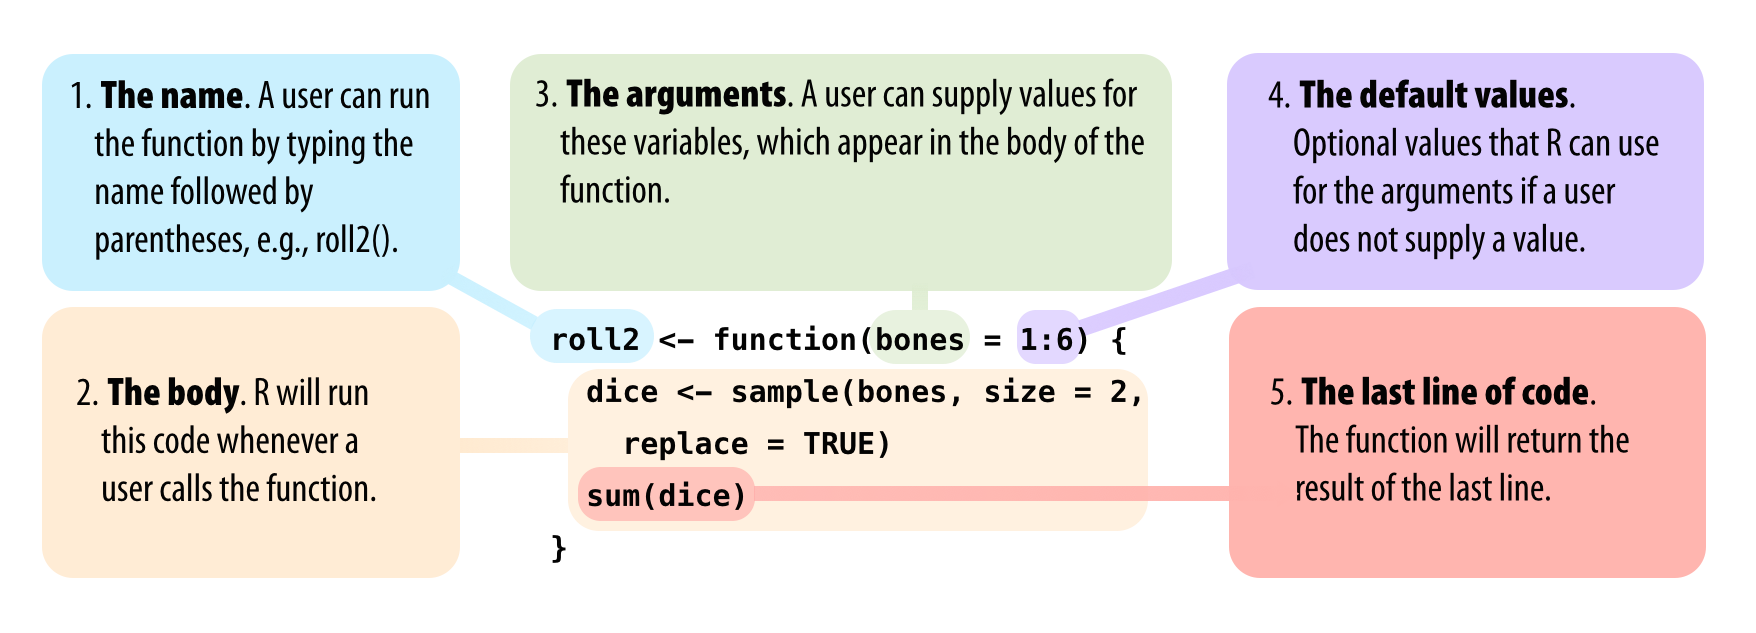
Source: (Grolemund 2014, sec. 2.5)