🗓️ Week 01
Welcome to the course

LSE DS202 – Data Science for Social Scientists

19 Jan 2026

Who we are

Your lecturer

Photo of Ghita Berrada
Dr. Ghita Berrada
Assist. Prof. (Education)
LSE Data Science Institute
📧 E-mail
lecturer
course convenor
  • PhD in Computer Science (University of Twente, Netherlands)
  • Background: Engineering, Databases, Health Informatics, ML for cybersecurity
  • Formerly Research Associate at King’s College London and the University of Edinburgh (School of Informatics)

decision support systems
machine learning applications
databases
provenance
ethical AI/XAI

Teaching Assistants

Photo of Stuart Bramwell
Dr Stuart Bramwell
Guest Lecturer
Data Science Institute
DPhil in Politics (Oxford University)
📧 E-mail
guest teacher
Photo of Yassine Lahna
Yassine Lahna
Data Scientist
MSc in Statistical Science (Oxford University)
📧 E-mail
guest teacher
Photo of Jonas Weinert
Jonas Weinert
MPhil/PhD candidate in Health Policy and Health Economics (LSE)
Research Consultant: Development Impact Evaluations (World Bank Group)
📧 E-mail
guest teacher

Administrative Support

Photo of Kevin Kittoe
Kevin Kittoe
Teaching and Learning Administrator
LSE Data Science Institute
📧 E-mail

Write an e-mail to Kevin:

  • if you cannot find the lecture recording on Moodle
  • when you need an extension for an assignment (👉 check LSE’s extension policy)
  • to request a class group change (you will be asked to provide a reason)
  • to inform us of any other issues that may affect your studies

The Data Science Institute

  • This course is offered by the LSE Data Science Institute (DSI)
  • DSI is the hub for LSE’s interdisciplinary collaboration in data science
  • ⏭️ Let’s see a few activities that might be of interest to you

CIVICA Seminar Series

Careers in Data Science

Hear from alumni or industry experts about their career paths and how they got to where they are today.

Past events:

🗓️ Navigating Data Science from Academia to Media, and Beyond (23 October 2024 - 4.30 to 6pm)

With the rise in adoption of AI/ML technologies and the increasing demand for data-driven decision-making, data science has become a vital component across many industries, including media. As data science transforms the media landscape - enhancing content personalisation, optimising conversion strategies, and improving audience engagement, it is also becoming an increasingly popular tool for addressing complex business challenges. Navigating a role in this field can be both exciting and challenging.

Tabtim Duenger, Senior Data Scientist at The Economist and Riya Chhikara, Data Scientist at the Economist, both LSE graduates1, will offer insights into their paths to entering the field of data science. They will discuss their experiences in landing their first roles, negotiating their functions and responsibilities within the media sector, and how they use these experiences and networks to continue guiding their careers.

Careers in Data Science

Hear from alumni or industry experts about their career paths and how they got to where they are today.

Upcoming events:

🗓️ Data science in transport: every career journey matters (11 February 2026 - 4.00 to 5.30pm)

The journey from academia to industry can be a daunting one. What does data science in industry look like day-to-day? How do you apply theory to business problems with tight deadlines and messy data?

This session brings together data science experts from Transport for London (TfL)1 to map out their journeys from academia to one of the world’s leading and data rich transport authorities. They will explore what actually matters in industry data science, how to position your experience, and why working on transport problems offers a mix of technical challenges and social impact.

Industry “field trips”

Visit to the FCA (Nov 2025)

Visit to the Cabinet Office (Feb 2025)

Visit at the Bank of England (Oct 2024)

Who are you?

Programme Freq
General Course 14
BSc in Economics 10
BSc in Psychological and Behavioural Science 4
BSc in Politics and Data Science 3
BSc in Social Anthropology 2
BSc in Philosophy and Economics 1
BSc in Philosophy, Politics and Economics 1
BSc in Sociology 1
Year Count
1 17
2 10
3 11
4 2

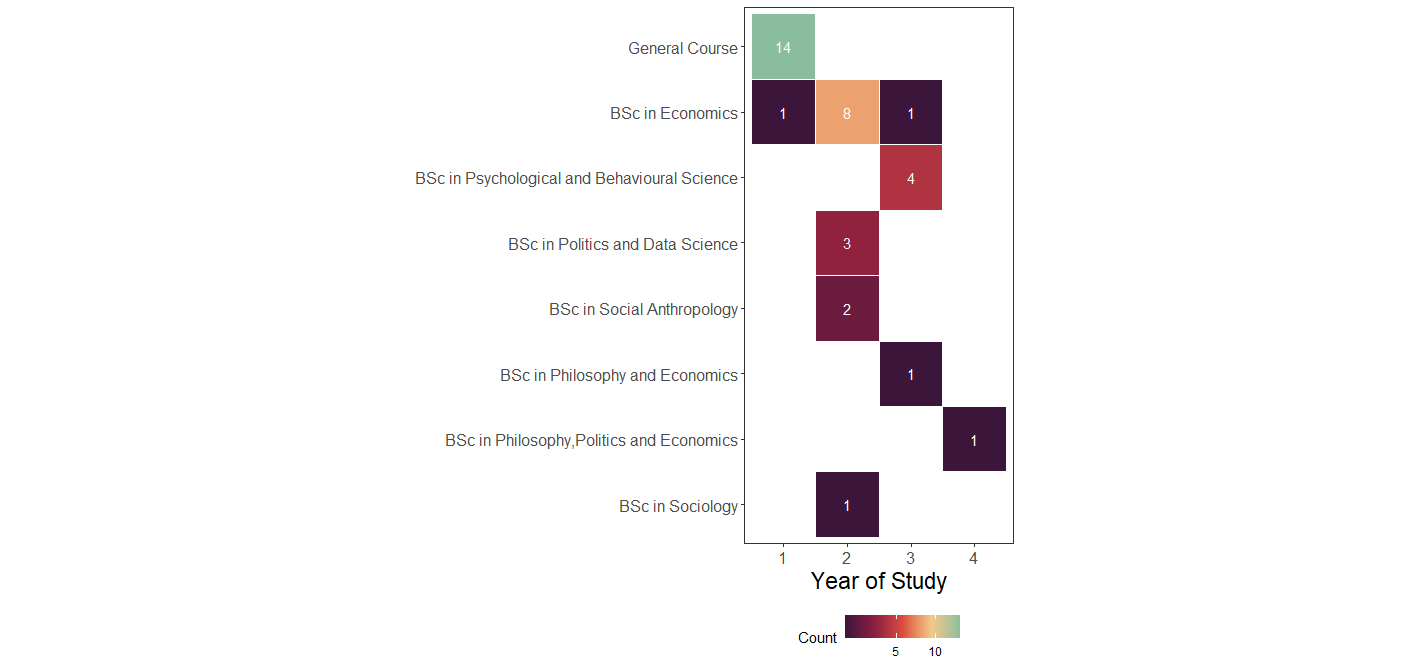
Who are you? (cont.)

Who are you? — conclusions

This cohort brings:

  • different disciplinary instincts
  • different expectations of “data”
  • different ways of interpreting results

A first data-quality issue

  • General Course students appear as “Year 1”
  • This reflects how the data was recorded
  • Not the underlying reality

A note on data skepticism

Official statistics feel authoritative — but embed assumptions.

Inflation

  • Inflation relies on a basket of goods
  • Baskets differ across countries
  • Baskets are updated over time as consumption changes

Question:
Is inflation directly comparable across countries? Across decades?

GDP over time

  • GDP definitions evolve
  • Countries periodically rebase GDP
  • What counts as “economic activity” changes

A GDP value in 1995 is not strictly the same object as GDP in 2025.

GDP and lived reality

  • Two countries can have similar GDP
  • Yet vastly different:
    • inequality
    • poverty
    • access to services

GDP masks distributional differences.

Note

Data rarely lies —
but it simplifies, omits, and encodes choices.

What is this course about?

Course Brief

What is this course about?

  • Focus: learn and understand the most fundamental machine learning algorithms
  • How: practical use of machine learning techniques and metrics, applied to relevant datasets

Course Brief

What is this course about?

  • Focus: learn and understand the most fundamental machine learning algorithms
  • Mostly no neural networks or deep learning
  • No large-scale data
  • How: practical use of machine learning techniques and metrics
  • Some theory, but no heavy derivations
  • Lots of coding, examples, and exercises

Course Brief

Two critical principles

1. Learn to learn

  • We provide building blocks, not everything
  • You will read documentation
  • You will explore independently
  • Homework is where learning happens

2. No single “right answer”

  • Data science is about justified choices
  • You must explain why you chose:
    • a model
    • a parameter
    • a metric
  • Interpretation matters as much as (if not more than) implementation

🎯 Learning Objectives

  • Understand the fundamentals of the data science approach, with emphasis on social science applications
  • Treat classical methods (e.g. regression, PCA) as machine learning approaches
  • Fit and apply supervised machine learning models
  • Evaluate and compare models
  • Improve model performance
  • Use applied programming throughout the course
  • Apply methods to real data
  • Integrate data insights into decision-making
  • Work with text data using ML techniques
  • Understand how methods are applied in practice

📚 Course Structure

  • How will this course be taught?
  • How do I prepare?

A summary of the course structure

👩🏻‍🏫 Lectures (first in the week)

  • Introduce concepts and tools
  • Live coding and reasoning
  • Focus on why decisions are made

🧑🏻‍💻 Labs (later in the week)

  • Deepen selected concepts
  • Sometimes introduce new tools
  • Emphasis on depth, not breadth

✍️ Assignments

  • Open by design
  • Multiple valid approaches
  • Mirror real-world ambiguity
  • Designed as learning opportunities

Important

The goal is to eventually perform analysis
without step-by-step help.

👩🏻‍🏫 Lectures (2 hours per week)

  • Lectures come first each week
  • Early weeks include slides
  • Most sessions involve live coding
  • You are encouraged to code along
  • Group discussions to interpret results
  • Bring a laptop if you can
  • Recordings available on Moodle the next working day

🧑🏻‍💻 Labs (90 minutes per week)

  • Labs come after lectures
  • They:
    • deepen specific concepts
    • sometimes introduce new tools
  • Emphasis on depth, not breadth
  • Designed to give you the building blocks to work independently

Important

You must attend the lab you are enrolled in.
You cannot switch labs on the day.

More about 🧑🏻‍💻 Labs

Each week, you will receive a roadmap.

Type Description
🧑🏻‍🏫 Teaching moment Full attention required
🎯 Action points Follow steps, try first, ask if stuck
👥 In pairs/groups Learn from peers
🗣️ Discussion Interpret results
📝 Submission Submit work

Where to find course information

Primary sources of truth

  • 🌐 Course website
  • 💬 Slack

Moodle:

  • mirrors the website content
  • hosts submissions and recordings

Note

If something seems missing on Moodle:

→ check the website
→ check Slack
→ then ask

What could data science be used for?

Datasets in this course are provided.

However:

  • you can suggest applications
  • you can suggest types of data
  • we often discuss how methods transfer across domains

Note

In practice, you rarely choose the data —
but you constantly ask what else it could be used for.

Programming

Programming language

Python

IDE option

VS Code
  • General-purpose IDE
  • Requires some setup
  • We guide you through it

Pre-requisites and assumptions

We assume basic knowledge of:

  1. Descriptive statistics
  2. Some linear algebra
  3. Programming
  • ST102 is sufficient preparation
  • Linear algebra is mostly matrix operations
  • New to Python? Budget extra practice time

New to Python?

Python Environment Management

Why environment management matters

  • Different packages require different Python versions
  • ML libraries often lag behind the latest Python release
  • Reproducibility depends on controlled environments

Our approach in this course

Weeks 1–4: Python 3.13

  • Latest Anaconda distribution
  • Excellent support for:
    • pandas
    • numpy
    • matplotlib
    • seaborn
  • Ideal for data wrangling and exploration

Week 5 onwards: Python 3.12

  • Better support for:
    • scikit-learn
    • statsmodels
  • Some ML packages are not yet available for 3.13
  • We will guide you through the switch

Managing environments with conda

# Check Python version
python --version

# Create environment
conda create -n ds202 python=3.13

# Activate environment
conda activate ds202

Generative AI Tools Policy

There are three official positions at LSE:

Position 1 No authorised use of generative AI in assessment (Grammar/spell-checking may be exempt)

Position 2 Limited authorised use of generative AI

Position 3 Full authorised use of generative AI 👉 This is the position adopted in this course

Source: LSE School position on generative AI, September 2024

Responsible Use of AI

Our policy: Responsible use (not optional)

You MAY use

  • ChatGPT, Copilot, Claude, etc.
  • For lectures, labs, and assignments

⚠️ You MUST

  • Acknowledge every use
  • Explain how you used it
  • Verify and understand all outputs
  • Critically evaluate suggestions

You MAY NOT

  • Use AI when explicitly forbidden (unlikely to happen but do check)
  • Submit AI output without understanding it
  • Present AI work as fully your own
  • Forget to acknowledge use of AI in an assignment

Example acknowledgement

“I used ChatGPT to debug a pandas merge. It suggested pd.merge() with on='date', which produced duplicates. After checking the documentation, I changed the join type to how='left'.”

Why this matters

  • Responsible use is a core professional skill
  • We ran a study on how AI affects learning outcomes. You can see some of the results here

👉 Full policy available on course website/Moodle — read it carefully

Teaching Philosophy

Empirical, experience-focused learning

  • Learning by doing
  • Trial and error is expected
  • You often meet concepts before formal explanations
  • Struggle is part of learning

This is not a “spoon-feeding” course

  • We provide structure and guidance
  • You build understanding through practice
  • Reading documentation and additional materials is expected
  • Questions are welcome — especially after trying

Image created with DALL·E via Bing Chat.
Prompt: “Person climbing a mountain of books, using a compass and magnifying glass.”

Python Comfort Check

We’ll do a quick live poll using Mentimeter.

👉 Go to menti.com and enter the code shown on screen
(or scan the QR code).

How we’ll use the results

  • 70% comfortable → short refresher

  • 40–70% → moderate review
  • <40% → extended review

We will adapt the pace accordingly.

What do we mean by data science?

Data science is…

“…a field of study and practice that involves the collection, storage, and processing of data in order to derive important 💡 insights into a problem or a phenomenon.”

Such data may be generated by humans (surveys, logs, administrative data) or machines (sensors, transaction systems, digital traces),

and may exist in many formats (text, audio, images, video, etc.).”

The academic possibilities

  • Humans and machines nowadays generate A LOT of data ALL THE TIME
  • It has become very cheap to collect and store this data
  • This abundance of data opens up new possibilities for research & policy-making

New data to answer old questions:

  • How do rumours spread?
  • How can we predict unemployment rates accurately?

New questions enabled by new data/new technologies:

  • Is social media a threat to democracy/public order?
  • Is generative AI a threat to the job market?

This course equips you to engage with such questions
using data, models, and justification.

Data science and social science

👉 Traditional statistics (social sciences)
Focus: explanation

👉 Data science
Focus: exploration and prediction

  • Strong influence from computer science and engineering
  • Emphasis on:
    • computational efficiency
    • scalability
  • Many methods can serve both explanatory and predictive goals

The Data Science Workflow

start Start gather Gather data   start->gather store Store it          somewhere gather->store       clean Clean &         pre-process store->clean       build Build a dataset clean->build       eda Exploratory     data analysis build->eda ml Machine learning eda->ml       insight Obtain    insights ml->insight       communicate Communicate results          insight->communicate       end End communicate->end

The Data Science Workflow

start Start gather Gather data   start->gather end End store Store it          somewhere gather->store       clean Clean &         pre-process store->clean       build Build a dataset clean->build       eda Exploratory     data analysis build->eda ml Machine learning eda->ml       insight Obtain    insights ml->insight       communicate Communicate results          insight->communicate       communicate->end

It is often said that 80% of the time and effort spent on a data science project goes to the abovementioned tasks.

The Data Science Workflow

start Start gather Gather data   start->gather end End store Store it          somewhere gather->store       clean Clean &         pre-process store->clean       build Build a dataset clean->build       eda Exploratory     data analysis build->eda ml Machine learning eda->ml       insight Obtain    insights ml->insight       communicate Communicate results          insight->communicate       communicate->end

This course is mostly about the ‘20%’ stage. Most of the data we will give you is already clean and ready to be modeled with machine learning.


Next week, we will discuss together what it means for a machine to learn something.


The 80/20 reality

It is often said that 80% of a data science project involves:

  • data collection
  • cleaning
  • alignment
  • preparation

In this course

  • We focus mainly on the “20%”:

    • exploration
    • modelling
    • interpretation
  • But you will experience the “80%” at times as well

Most datasets you receive are pre-cleaned… …but we will try and expose you to realistic messiness as much as possible (including in assignments!).

Note

Your first formative includes a gentle introduction to the 80%. No panic — support is built in.

Real example: Bank of England interest rates

The problem

Question

Will the Bank of England hold, increase, or decrease interest rates at the next rate-setting meeting?

Why this matters

  • Mortgage rates
  • Savings returns
  • Business investment
  • Economic growth

This was a real assignment in a previous year (last year’s W08 summative).

By the end of this course, you will be able to tackle it yourself.

Step 0 — What data do we need?

This stage requires domain knowledge.

Plausible indicators

  • Inflation (CPIH)
  • GDP growth
  • Consumer confidence
  • Exchange rates
  • Gilt yields
  • Unemployment

At this stage:

  • we err on the side of inclusion
  • we justify choices conceptually

Later, during modelling, we:

  • evaluate usefulness
  • remove redundant features
  • perform feature selection

Step 1 — Gathering the data

Different indicators come from different institutions:

  • ONS
  • OECD
  • Bank of England
  • Federal Reserve

Immediate challenges

  • different formats
  • different frequencies
  • different date conventions
  • missing values

Warning

Same concept ≠ same data structure

Step 2: The alignment challenge

The tricky bit:

For each BoE decision date, calculate 3-month average of each indicator

Example:

  • Decision date: 06/05/1997
  • Calculate average GDP for: May 1997, April 1997, March 1997
  • Repeat separately for all 6 other indicators
  • Align everything to the decision date

Why this matters:

  • BoE makes decisions based on recent economic context
  • Need to capture the “state of the economy” at decision time
  • Must handle:
    • Monthly vs quarterly data
    • Missing values
    • Different date formatting (UK vs US formats!)
    • Alignment of different time series

Tip

This is the 80%: Getting data into the right shape for analysis

Step 2 — The alignment challenge (continued)

Why aggregate to quarters?

  • Monetary policy decisions reflect recent economic performance

  • Quarterly aggregation:

    • reduces noise
    • aligns indicators
    • encodes a hypothesis about decision-making

Important

  • This is an assumption
  • It must be justified
  • It can be challenged

Tip

Data science involves making hypotheses — not just running algorithms.

Step 3 — Only now can we predict

  • Explore patterns
  • Fit models
  • Evaluate performance
  • Interpret results

A major challenge: distribution shift

  • Models learn from the past
  • The world changes
  • Past patterns may break

Examples:

  • 2008 financial crisis
  • COVID-19
  • Brexit

The journey ahead

For this, let’s have a look at the course syllabus

The 80/20 reality — a concrete example

Before: messy reality

  • merged cells
  • inconsistent headers
  • mixed date formats
  • footnotes embedded in data
  • missing values coded in multiple ways

After: analysis-ready

decision_date  rate_change  cpih   gdp   cci
1997-05-06          0.25    2.8   1.2   102
1997-07-10          0.25    2.9   1.3   104
1997-09-04          0.00    3.0   1.1   103
  • one observation per row
  • consistent date format
  • clean column names
  • missingness handled explicitly

Note

This is where most real work happens — and where most insight is created.

🧋Time for a break

Image created with DALL·E.
Prompt: “Cat drinking tea in a classroom, Renoir style.”

Coming up next

  • Python review
  • Environment setup
  • First hands-on work

Take ~10 minutes, then we continue.

Let’s get more technical

Python vs R

A few indicators

Python vs R

Python
  • General-purpose language

  • Used across:

    • data science
    • web development
    • ML / AI
    • production systems
R
  • Designed for statistics

  • Excellent for:

    • exploratory analysis
    • statistical modelling
  • Less common in production ML

Some Python basics

Data types

  • In R, assignment uses <-:
temperature <- 18
  • Basic types:
city <- "London"
inflation <- 4.2
year <- 2025
as.integer(year)

  • In Python, assignment uses =:
temperature = 18
  • Basic types:
city = "London"
inflation = 4.2      # float
year = 2025          # int

multiline_note = """Policy decisions
are rarely based
on a single number."""

In Python, types matter — be explicit.

Python basics

Python lists

# Monthly inflation rates
inflation = [9.1, 8.4, 7.9, 6.8]
inflation
[9.1, 8.4, 7.9, 6.8]
inflation.append(6.2)
inflation

[9.1, 8.4, 7.9, 6.8, 6.2]
# New months arrive
inflation.extend([5.5, 4.9])
inflation
[9.1, 8.4, 7.9, 6.8, 6.2, 5.5, 4.9]
forecast = [4.5, 4.2]
forecast += [3.9]
forecast
[4.5, 4.2, 3.9]

Python basics

Python lists (cont.)

mixed_record = [2025, "UK", 4.2]
mixed_record
[2025, 'UK', 4.2]


quarterly = [
  [9.1, 8.4, 7.9],
  [6.8, 6.2, 5.5]
]
inflation[0]
quarterly[0][-1]
quarterly[1][1]

returns:

9.1
7.9
6.2

Python basics

Tuples

location = (51.5072, -0.1276)  # latitude, longitude
location
(51.5072, -0.1276)


location[0]

Tuples are immutable.

To “update” them, you must create a new one.

Python basics

Dictionaries

country_stats = {
  "country": "UK",
  "inflation": 4.2,
  "year": 2025
}


country_stats["inflation"]
{'country': 'UK', 'inflation': 4.2, 'year': 2025}


country_stats["gdp_growth"] = 0.6
country_stats
{'country': 'UK', 'inflation': 4.2, 'year': 2025, 'gdp_growth': 0.6}

Python basics

Repeating operations

adjusted = []
for rate in inflation:
    adjusted.append(rate * 0.9)
adjusted = [rate * 0.9 for rate in inflation]


squared = {x: x**2 for x in range(5)}

Python basics

Custom functions

def adjust_for_policy(rate):
    return rate * 0.9


adjust_for_policy(6.2)

Functions encapsulate decisions, not just code.

Python basics

Custom functions definition

Let’s define functions based on the loops and list comprehensions. We’ll do some code profiling!

import cProfile

def for_loop_example():
    result = []
    for i in range(100000):
        result.append(i * 2)

def while_loop_example():
    result = []
    i = 0
    while i < 100000:
        result.append(i * 2)
        i += 1

def list_comprehension_example():
    result = [i * 2 for i in range(100000)]

# Profile each function
print("Profiling for loop:")
cProfile.run("for_loop_example()")

print("\nProfiling while loop:")
cProfile.run("while_loop_example()")

print("\nProfiling list comprehension:")
cProfile.run("list_comprehension_example()")

Python basics

Results from the loops and list comprehension profiling

Profiling for loop:
         100004 function calls in 0.022 seconds

   Ordered by: standard name

   ncalls  tottime  percall  cumtime  percall filename:lineno(function)
        1    0.013    0.013    0.021    0.021 <python-input-66>:3(for_loop_example)
        1    0.001    0.001    0.022    0.022 <string>:1(<module>)
        1    0.000    0.000    0.022    0.022 {built-in method builtins.exec}
   100000    0.008    0.000    0.008    0.000 {method 'append' of 'list' objects}
        1    0.000    0.000    0.000    0.000 {method 'disable' of '_lsprof.Profiler' objects}


Profiling while loop:
         100004 function calls in 0.021 seconds

   Ordered by: standard name

   ncalls  tottime  percall  cumtime  percall filename:lineno(function)
        1    0.014    0.014    0.020    0.020 <python-input-66>:8(while_loop_example)
        1    0.001    0.001    0.021    0.021 <string>:1(<module>)
        1    0.000    0.000    0.021    0.021 {built-in method builtins.exec}
   100000    0.006    0.000    0.006    0.000 {method 'append' of 'list' objects}
        1    0.000    0.000    0.000    0.000 {method 'disable' of '_lsprof.Profiler' objects}


Profiling list comprehension:
         4 function calls in 0.003 seconds

   Ordered by: standard name

   ncalls  tottime  percall  cumtime  percall filename:lineno(function)
        1    0.002    0.002    0.002    0.002 <python-input-66>:15(list_comprehension_example)
        1    0.001    0.001    0.003    0.003 <string>:1(<module>)
        1    0.000    0.000    0.003    0.003 {built-in method builtins.exec}
        1    0.000    0.000    0.000    0.000 {method 'disable' of '_lsprof.Profiler' objects}

From Jupyter Notebook to HTML

Why?

  • Share clean, readable output
  • No Python environment required for viewers
  • Same toolchain as your slides

Step 1 — Save your notebook

Your file:


python_basics.ipynb

Step 2 — Render with Quarto

From the terminal:

quarto render python_basics.ipynb

This creates:

python_basics.html

Optional: control output

quarto render python_basics.ipynb --to html

Note

The same Quarto engine renders:

  • slides
  • notebooks
  • reports

One tool, many outputs.

Coming up

Next labs

  • Python language basics (W01)
  • pandas basics for data manipulation (W02)

Before then

  • check the course website
  • join Slack
  • make sure Python runs

Office hours

  • see course website for times

References

Roser, Max, Hannah Ritchie, and Edouard Mathieu. 2023. “Technological Change.” Our World in Data. https://ourworldindata.org/technological-change.
Shah, Chirag. 2020. A Hands-on Introduction to Data Science. Cambridge, United Kingdom ; New York, NY, USA: Cambridge University Press. https://librarysearch.lse.ac.uk/permalink/f/1n2k4al/TN_cdi_askewsholts_vlebooks_9781108673907.
Shmueli, Galit. 2010. “To Explain or to Predict?” Statistical Science 25 (3). https://doi.org/10.1214/10-STS330.