🗓️ Week 01
Welcome to the course
LSE DS202 – Data Science for Social Scientists
19 Jan 2026
Your lecturer

Assist. Prof. (Education)
LSE Data Science Institute
lecturer
course convenor
- PhD in Computer Science (University of Twente, Netherlands)
- Background: Engineering, Databases, Health Informatics, ML for cybersecurity
- Formerly Research Associate at King’s College London and the University of Edinburgh (School of Informatics)
decision support systems
machine learning applications
databases
provenance
ethical AI/XAI
Teaching Assistants

Guest Lecturer
Data Science Institute
DPhil in Politics (Oxford University)
guest teacher

Data Scientist
MSc in Statistical Science (Oxford University)
guest teacher

Administrative Support

Teaching and Learning Administrator
LSE Data Science Institute
Write an e-mail to Kevin:
- if you cannot find the lecture recording on Moodle
- when you need an extension for an assignment
(👉 check LSE’s extension policy) - to request a class group change
(you will be asked to provide a reason for this) - to inform us of any other issues that may affect your studies
The Data Science Institute

- This course is offered by the LSE Data Science Institute (DSI).
- DSI is the hub for LSE’s interdisciplinary collaboration in data science
- ⏭️ Let’s see a few activities that might be of interest to you
CIVICA Seminar Series


Industry “field trips”

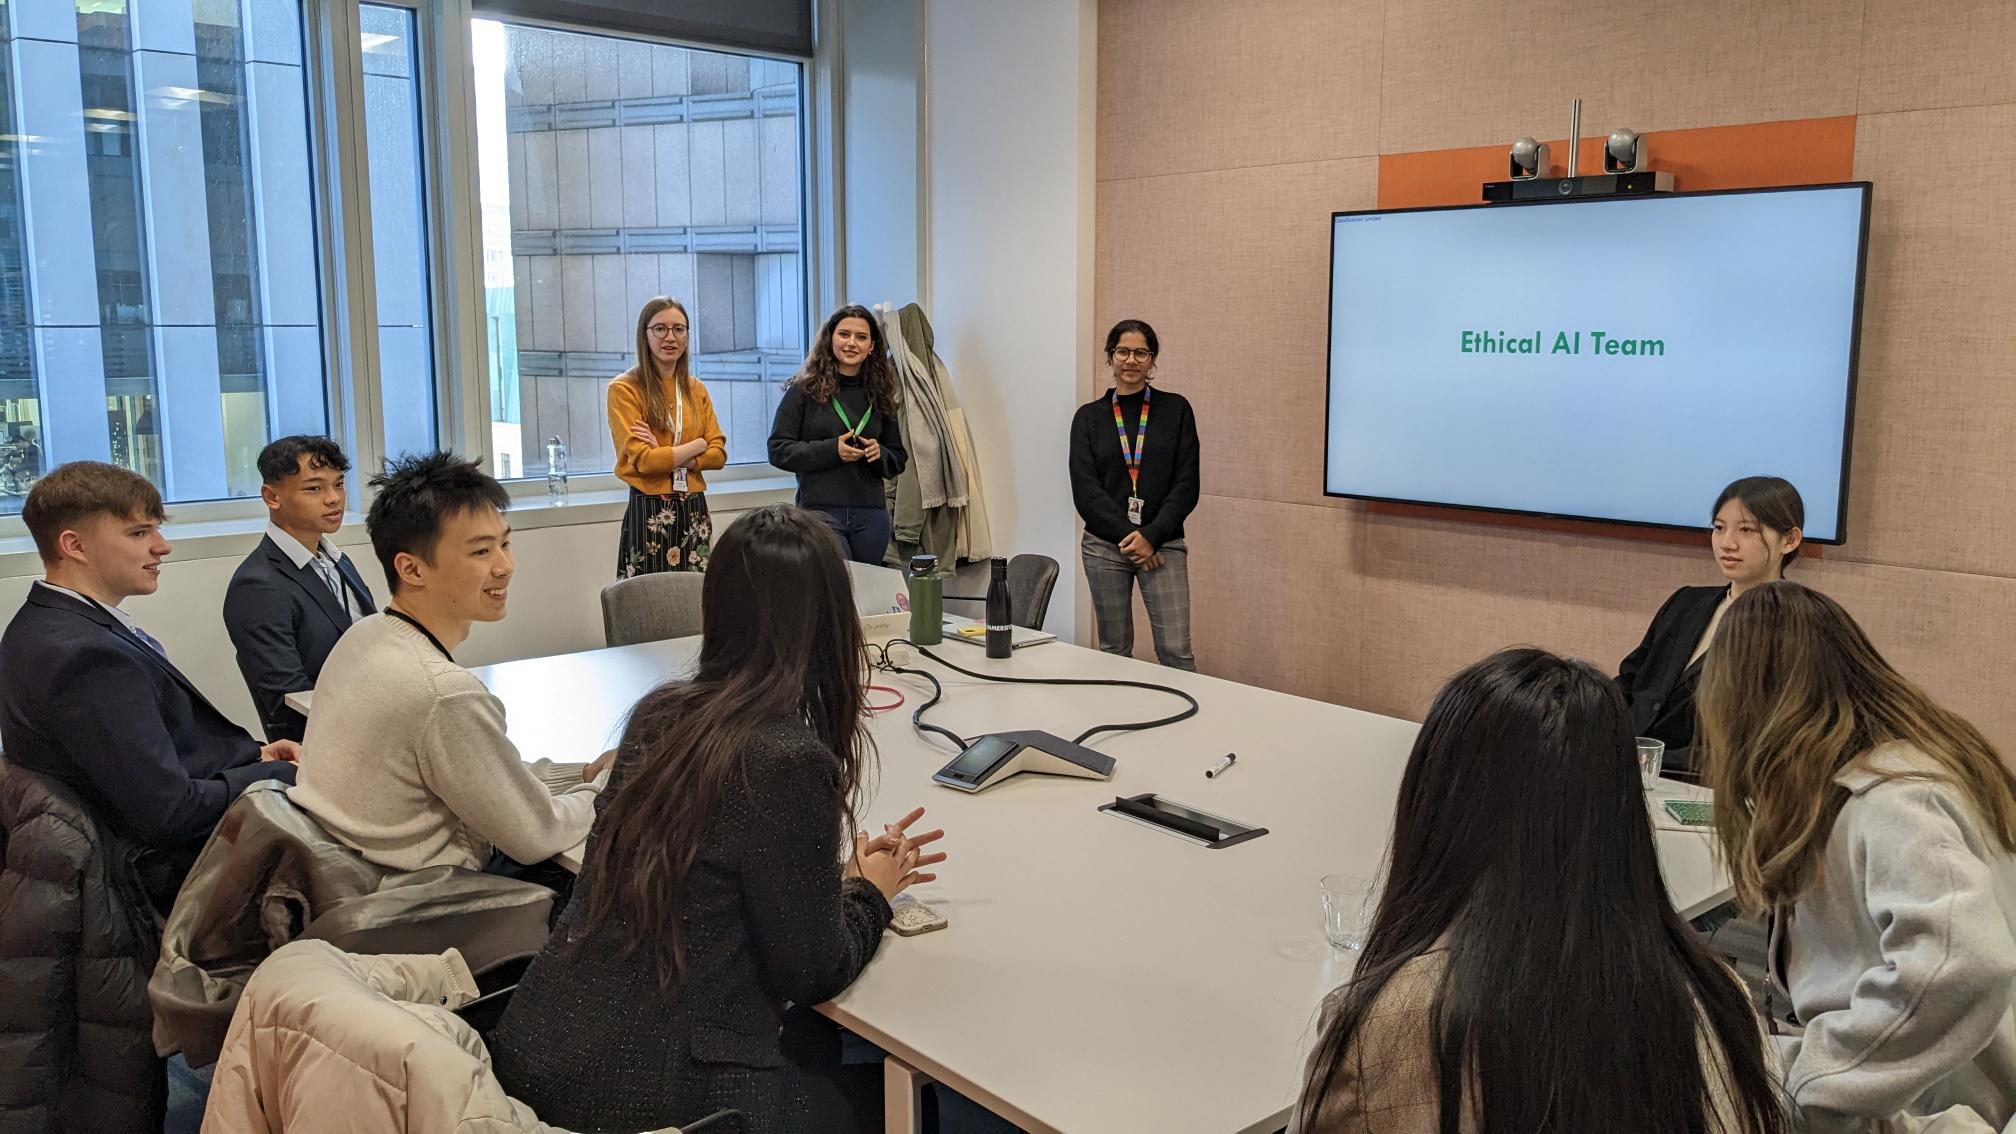
Who are you? (cont.)
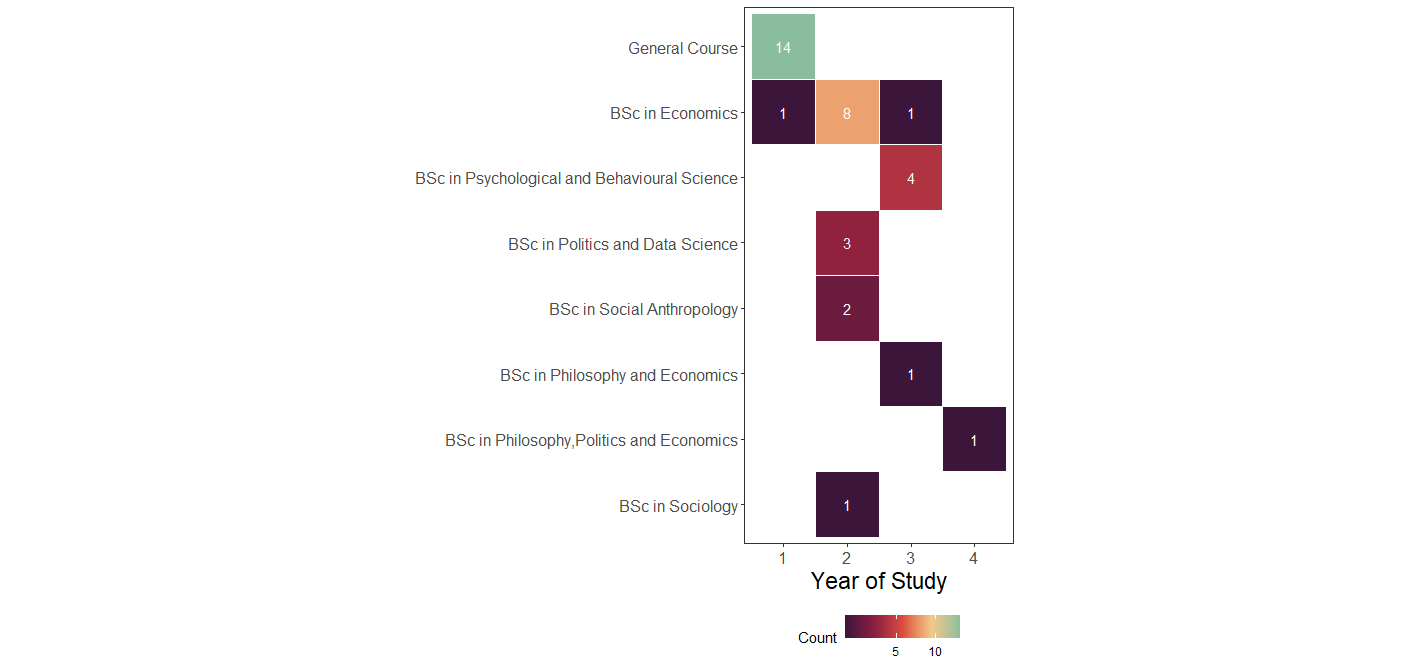
Key insight: Diverse backgrounds → diverse perspectives on DS problems
Course Rep Selection:
- We’ll elect a course representative in Week 2
- Important role: Represent student voice, provide feedback to teaching team
- Think about whether you’d like to nominate yourself!
![]() Course Brief
Course Brief
 Course Brief
What is this course about?
Focus: learn and understand the most fundamental machine learning algorithms
How: practical use of machine learning techniques and its metrics, applied to relevant data sets
![]() Course Brief
Course Brief
What is this course about?
- Focus: learn and understand the most fundamental machine learning algorithms
- No neural networks, no deep learning, no large-scale data
- How: practical use of machine learning techniques and its metrics, applied to relevant data sets
- Some but not a lot of theory, math proofs and derivations
- Lots of coding, examples and exercises
![]() Course Brief
Course Brief
Two Critical Principles:
1. Learn to Learn
- We provide essential building blocks, not everything on a platter
- You’ll need to read documentation, explore independently
- Homework is not optional - it’s where deep learning happens
- Ask questions, but try to solve problems first
2. No Single “Right Answer”
- Data science is about justified choices, not just code
- You must explain WHY you chose a model, parameter, metric
- Interpretation matters as much as implementation
- Context of the problem/dataset shapes your decisions
More about 🧑🏻💻 Labs (90 min each week)
Each week, you will have a roadmap of what to do.
The roadmap will typically contain the following elements:
| Type of activity | Description |
|---|---|
| 🧑🏻🏫 TEACHING MOMENT | Your class teacher deserves your full attention |
| 🎯 ACTION POINTS | Time to follow the steps in the roadmap. Try it for a bit, but if you get stuck, call your class teacher. |
| 👥 IN PAIRS/GROUPS | You will benefit from completing that task with your peers more than doing it alone |
| 🗣️ CLASSROOM DISCUSSION | Your class teacher will facilitate a discussion about the task |
| 📝 SUBMISSION | Submit your work |
👉 Now, let’s navigate our  Moodle page to see the 📓 Syllabus and to talk about ✍️ Assessments & Feedback.
Programming
- Programming Language:
- Integrated Development Environment (IDE) option:

- In this course, we use:
- VS Code is a more general IDE, good for many programming languages. The flip-side is that it requires a bit more configuration.
Teaching Philosophy
Empirical, experience-focused learning:
- Learning by doing (trial and error is encouraged!)
- You’ll often encounter new concepts before formal explanations
- Struggle is part of the process - ask “dumb questions”
- Help and learn from each other
This is not a “spoon-feeding” course:
- We provide building blocks and guidance
- You build understanding through practice and exploration
- Read documentation, try things, bring us your questions

The academic possibilities
- Humans and machines nowadays generate A LOT of data ALL THE TIME
- It has become very cheap to collect and store this data

- This abundance of data opens up new possibilities for research & policy-making
New data to answer old questions:
- How do rumours spread?
- How can we predict unemployment rates accurately?
New questions enabled by new data/new technologies:
- Is social media a threat to democracy/public order?
- Is generative AI a threat to the job market?
We hope that in this reformulated version of the DS202 course, you will learn how to tackle similar questions that are relevant to your field of study.
The 80/20 Reality
Before: Messy reality

- Merged cells, inconsistent formatting
- Multiple sheets with different structures
- Date formats: “Jan-97”, “01/1997”, “1997-01”
- Missing values marked as “..”, “N/A”, or blank
- Column names with special characters
- Footnotes mixed with data
After: Clean and ready
   decision_date  rate_change  cci   cpih   gdp  ...
0     1997-05-06         0.25  102  2.8  1.2
1     1997-07-10         0.25  104  2.9  1.3
2     1997-09-04         0.00  103  3.0  1.1
3     1997-11-06         0.25  105  3.1  1.4
...- Consistent date format (YYYY-MM-DD)
- No missing values (or properly handled)
- Clean column names
- One observation per row
- Ready for analysis!
Note
The message: Even government data needs serious cleaning. You’ll spend most of your time here, but that’s where real insights emerge.
☕️ Time for a break

Coming up next: Python Review & Setup
Take a 10-minute break, then we’ll dive into Python!
Python vs R
- Python is a general-purpose programming language
- It is used for web development, scientific computing, data science, advanced machine learning tools (deep learning), etc.
- R is more niche. It is a programming language created for statistical computing
- You can do many other things with R, but it is mostly used for statistics and general data science (except for heavy Machine Learning)
Some Python basics
Data types
![]()
- In R, you assign a variable using the operator
<-:
var <- 2- Some basic data types:
var <- "value" # A string. Single quotes are OK too

var <- 2.2     # A double (aka numeric)
var <- 2       # Also a double! 😱

# Want an integer? You have to be explicit:
var <- as.integer(2)![]()
- Whereas in Python, assignments are done with
=:
var = 2- The python equivalent:
var = "value" # A string. Single quotes are OK too
var = """I want to write
         sentence without caring for line breaks"""

var = 2.2      # A float
var = 2        # An int (🏅)
var = float(2) # A float
In Python, less is more! Always be explicit when using the greedier data types…
Python basics
Python lists
![]()
- We can put basic data types (i.e strings, integers, floats) in collections of data (e.g lists, dictionaries, tuples)
# I am creating a list of integers
l = [1, 2, 3, 4]
l
returns:
[1, 2, 3, 4]You could use the append method to add elements to a list:
l.append(5) # Adding element to list l in-place
l
returns:
[1, 2, 3, 4, 5]You could also use the extend method to add several elements:
l.extend([6,7,8]) # Adding elements in-place
l
returns:
[1, 2, 3, 4, 5, 6, 7, 8]Yet another way to add elements to a list:
l2 = [5,7,9]   # defining a list
l2 += [8,0,4]  # adding elements
l2
returns:
[5, 7, 9, 8, 0, 4]Python basics
Python lists (cont.)
![]()
- Lists don’t need to contain a single data type
mixed_type = [2.0, 7, "bananas"] # this is valid!- You can define lists of lists and lists of lists of lists, etc…
nested_list = [[1,2,3], [4,5,6]] # nested list- You can access elements of lists and nested lists:
l = [1, 2, 3, 4, 5, 6, 7, 8]
l[0]
returns:
1nested_list = [[1, 2, 3], [4, 5, 6]]
nested_list[0][-1]
nested_list[1][1]returns:
3
5
Python basics
Other types of data collections
![]()
- Aside from lists, you also have tuples
my_tuple = (1,2,3,4)
my_tuple
returns
(1, 2, 3, 4)my_tuple[1]returns
2What do you think is the difference here?
Tuples are immutable!
Is there a way to update tuples? Yes!
First method
my_tuple += (9,) # adding an elementSecond method
# convert tuple → list → tuple
temp = list(my_tuple)  # to list
temp += [9]            # append
my_tuple = tuple(temp) # back to tuple
Python basics
Other types of data collections
![]()
Aside from lists and tuples, you also have dictionaries and other more complex data collection types (see the documentation).
A Python dictionary is a collection of key-value pairs:
my_dict = {
    "first_name": "Jane",
    "last_name": "Doe",
    "city": "London"
}
my_dict
returns:
{'first_name': 'Jane', 'last_name': 'Doe', 'city': 'London'}You can access dictionary elements:
my_dict["first_name"]returns
'Jane'You can add an element to the dictionary:
my_dict["country"] = "UK"returns
{'first_name': 'Jane', 'last_name': 'Doe',
 'city': 'London', 'country': 'UK'}
Python basics
Some basic operations
![]()
- If you run:
type(my_dict)
type(var)
you will get the type of your Python object.
The above returns:
<class 'dict'>
<class 'float'> # since var = float(2.0)
You can get the length of a collection with the len function:
len(l)        # l = [1, 2, 3, 4, 5, 6, 7, 8]
len(my_tuple) # my_tuple = (1,2,3,4)
len(my_dict)  # my_dict = {'first_name': 'Jane', ...}
returns
8
4
4
Python basics
Sometimes, we need to perform operations repeatedly
![]()
We have loops (for or while loops):
result = []
for i in range(100000):
    result.append(i * 2)
result = []
i = 0
while i < 100000:
result.append(i * 2)
i += 1(Note that Python needs indentation and you absolutely can’t mix tabs and spaces!)
![]()
And you have list comprehensions (as well as dictionary comprehensions):
result = [i * 2 for i in range(100000)]# dictionary: number → its square
squares = {x: x**2 for x in range(10)}
print(squares)returns
{0: 0, 1: 1, 2: 4, 3: 9, 4: 16, 5: 25,
6: 36, 7: 49, 8: 64, 9: 81}# filter only even values
original_dict = {"a": 1, "b": 2, "c": 3, "d": 4}
filtered_dict = {k: v for k, v in original_dict.items()
if v % 2 == 0}
print(filtered_dict){'b': 2, 'd': 4}Python basics
Custom functions definition
def my_function(x):
return x + 1my_function(2)In R, the return keyword exists, but it is optional. Whatever is at the last line of the function will be returned.
my_function <- function(x) {
x + 1
}Python basics
![]() Custom functions definition
Custom functions definition
Let’s define functions based on the loops and list comprehension from before. We’ll do some code profiling!
import cProfile
def for_loop_example():
result = []
for i in range(100000):
result.append(i * 2)
def while_loop_example():
result = []
i = 0
while i < 100000:
    result.append(i * 2)
    i += 1
def list_comprehension_example():
result = [i * 2 for i in range(100000)]
# Profile each function
print("Profiling for loop:")
cProfile.run("for_loop_example()")
print("\nProfiling while loop:")
cProfile.run("while_loop_example()")
print("\nProfiling list comprehension:")
cProfile.run("list_comprehension_example()")pandas and scikit-learn (briefly)
![]()
- Python has a base set of functions and libraries that come with the installation (e.g
os,collections,math, etc. - see the Python documentation)
![]()
![]()
![]()
The
pandas,numpyandscikit-learnlibraries are not part of the standard Python libraries, but they are very popular and actively maintained packagesThese packages contain most of the functionality needed to handle datasets, manipulate them (
pandasmainly), perform statistical operations on them and apply machine learning modelsThese are the libraries we will rely on most in this course
Note to R users
Think of pandas as what tidyverse is to R and to some extent of scikit-learn, as what tidymodels (and perhaps caret) are to R.
A touch of pandas
Example: reading a csv file
![]()
import pandas as pd
my_data = pd.read_csv("my_file.csv")
Example: selecting columns
![]()
# accessing a column in the dataframe
my_data['col']
my_data.col  # works if column name has no spaces
my_data[['col1', 'col2']]  # multiple columns
A touch of pandas
![]()
![]()
Example: filtering rows
Filtering when the values are integers
df.query("col == 2") # integer columnFiltering when the values are strings
df.query("col == 'python'") # string columnExample: concatenating dataframes
Say we have two random datasets:
df1 = pd.DataFrame({
    "Name": ["Alice", "Bob"],
    "Age": [25, 30]
})

df2 = pd.DataFrame({
    "Name": ["Charlie", "David"],
    "Age": [35, 40]
})
If we want to concatenate vertically:
# Concatenate the DataFrames
result = pd.concat([df1, df2], ignore_index=True)
print(result)
which returns
