🗓️ Week 03
Computational Thinking and Programming
DS101 – Fundamentals of Data Science
13 Oct 2025
Horror Story #1: Gene Names

Source: (Vincent 2020)
What happened:
- Excel auto-converted gene names to dates
- MARCH1 (short for “Membrane Associated Ring-CH-Type Finger 1”) → 1-Mar
- SEPT2 (short for “Septin 2”)→ 2-Sep
The scale:
- 2016 study (Ziemann, Eren, and El-Osta 2016): ~20% of 3,597 genomics papers affected by Excel gene name conversion
- 2021 follow-up (Abeysooriya et al. 2021): Still 30.9% of 11,117 papers had errors
- Problem persisted despite awareness!
The fix: 27 genes officially renamed (MARCH1 → MARCHF1)
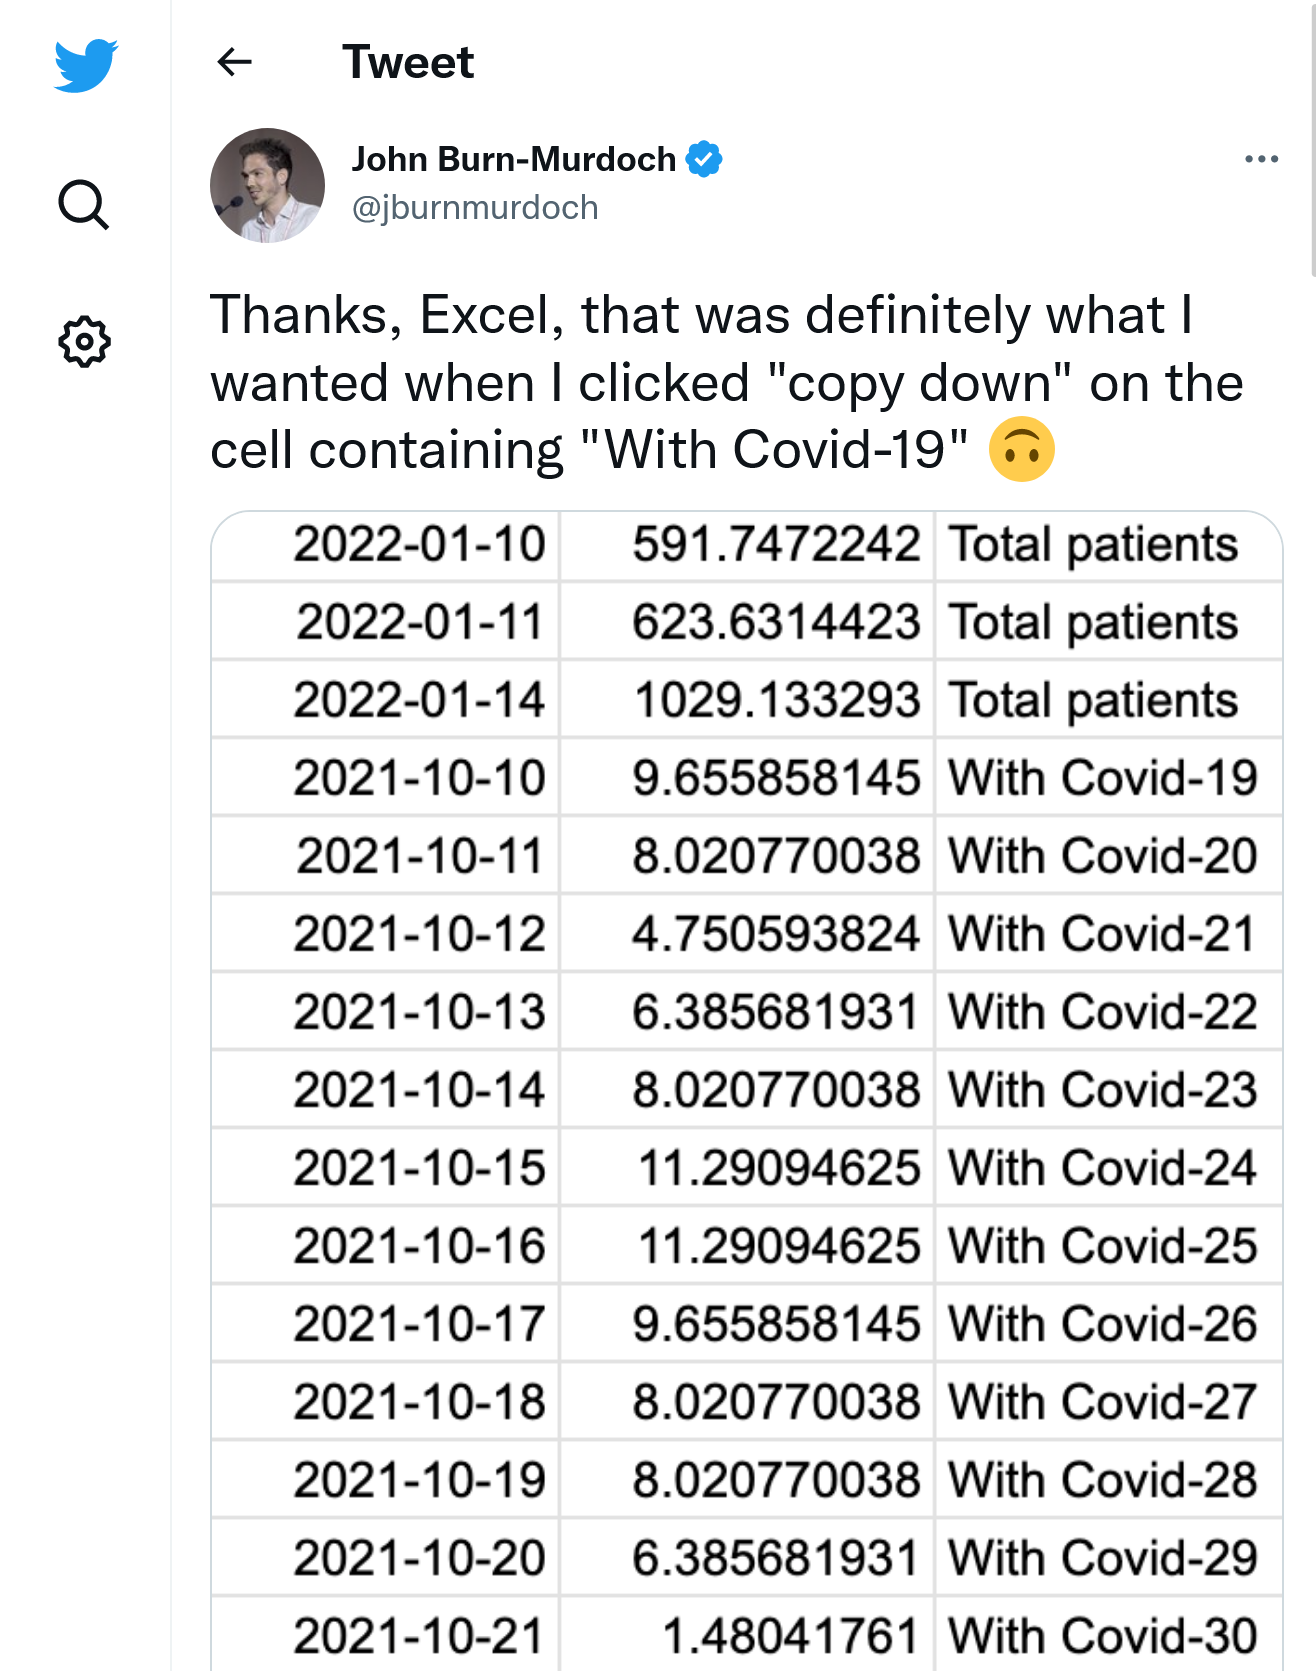
Horror Story #2: COVID-19 Data Loss
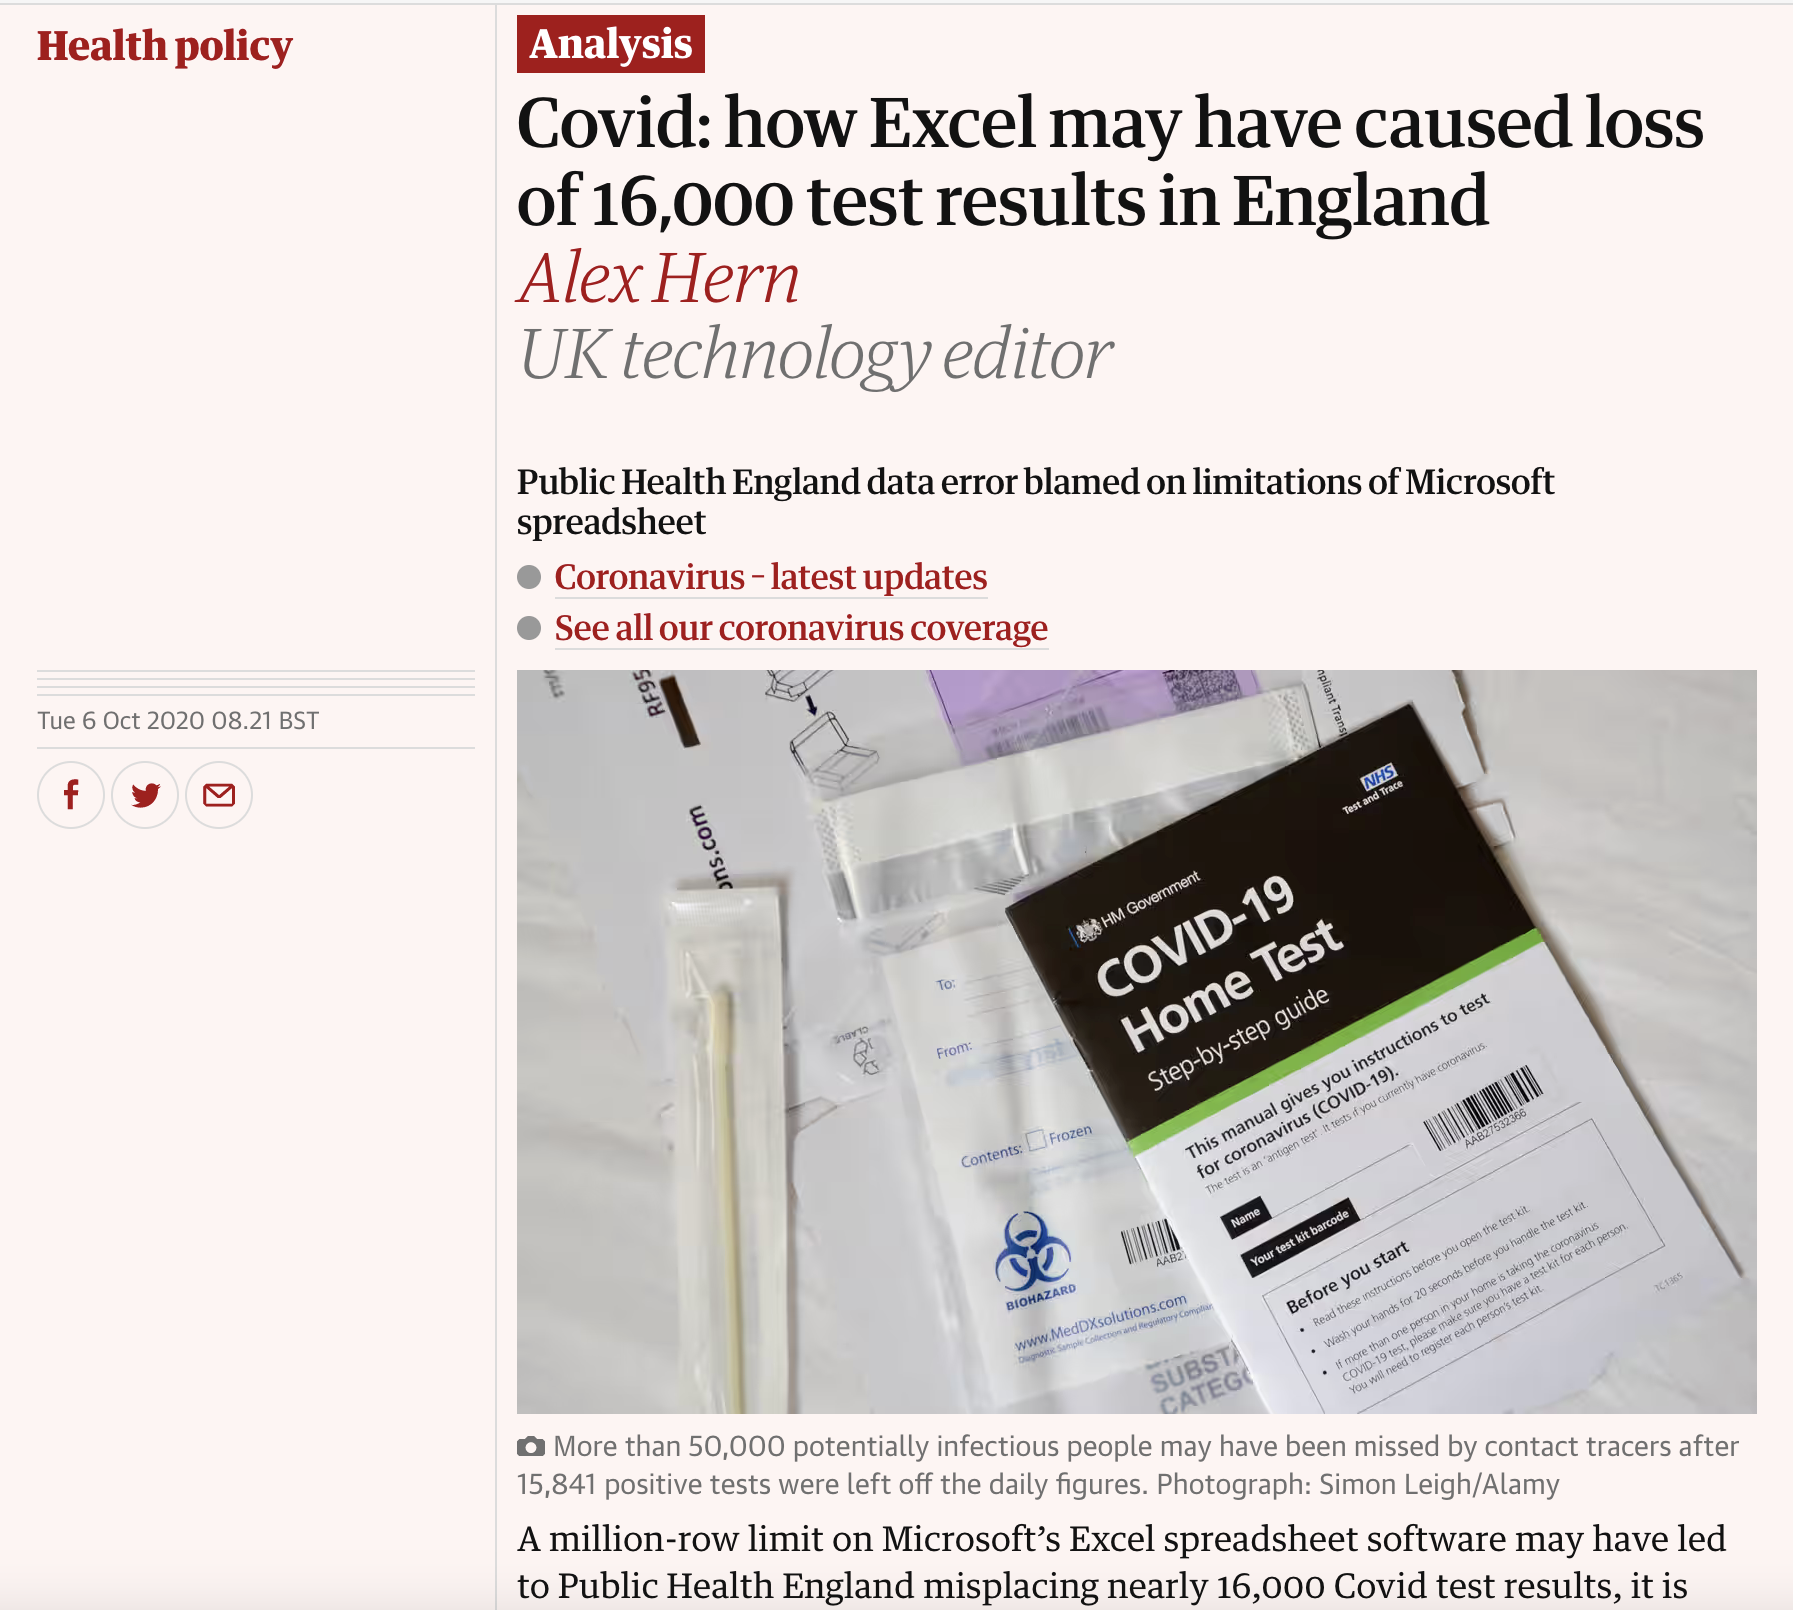
Source: (Hern 2020)
The incident:
- UK Public Health England used Excel as exchange format with local trusts
- Hit the 65,536 row limit
- Lost 16,000 COVID cases
- Delayed contact tracing
Impact: Lives at risk
Horror Story #3: Economic Policy
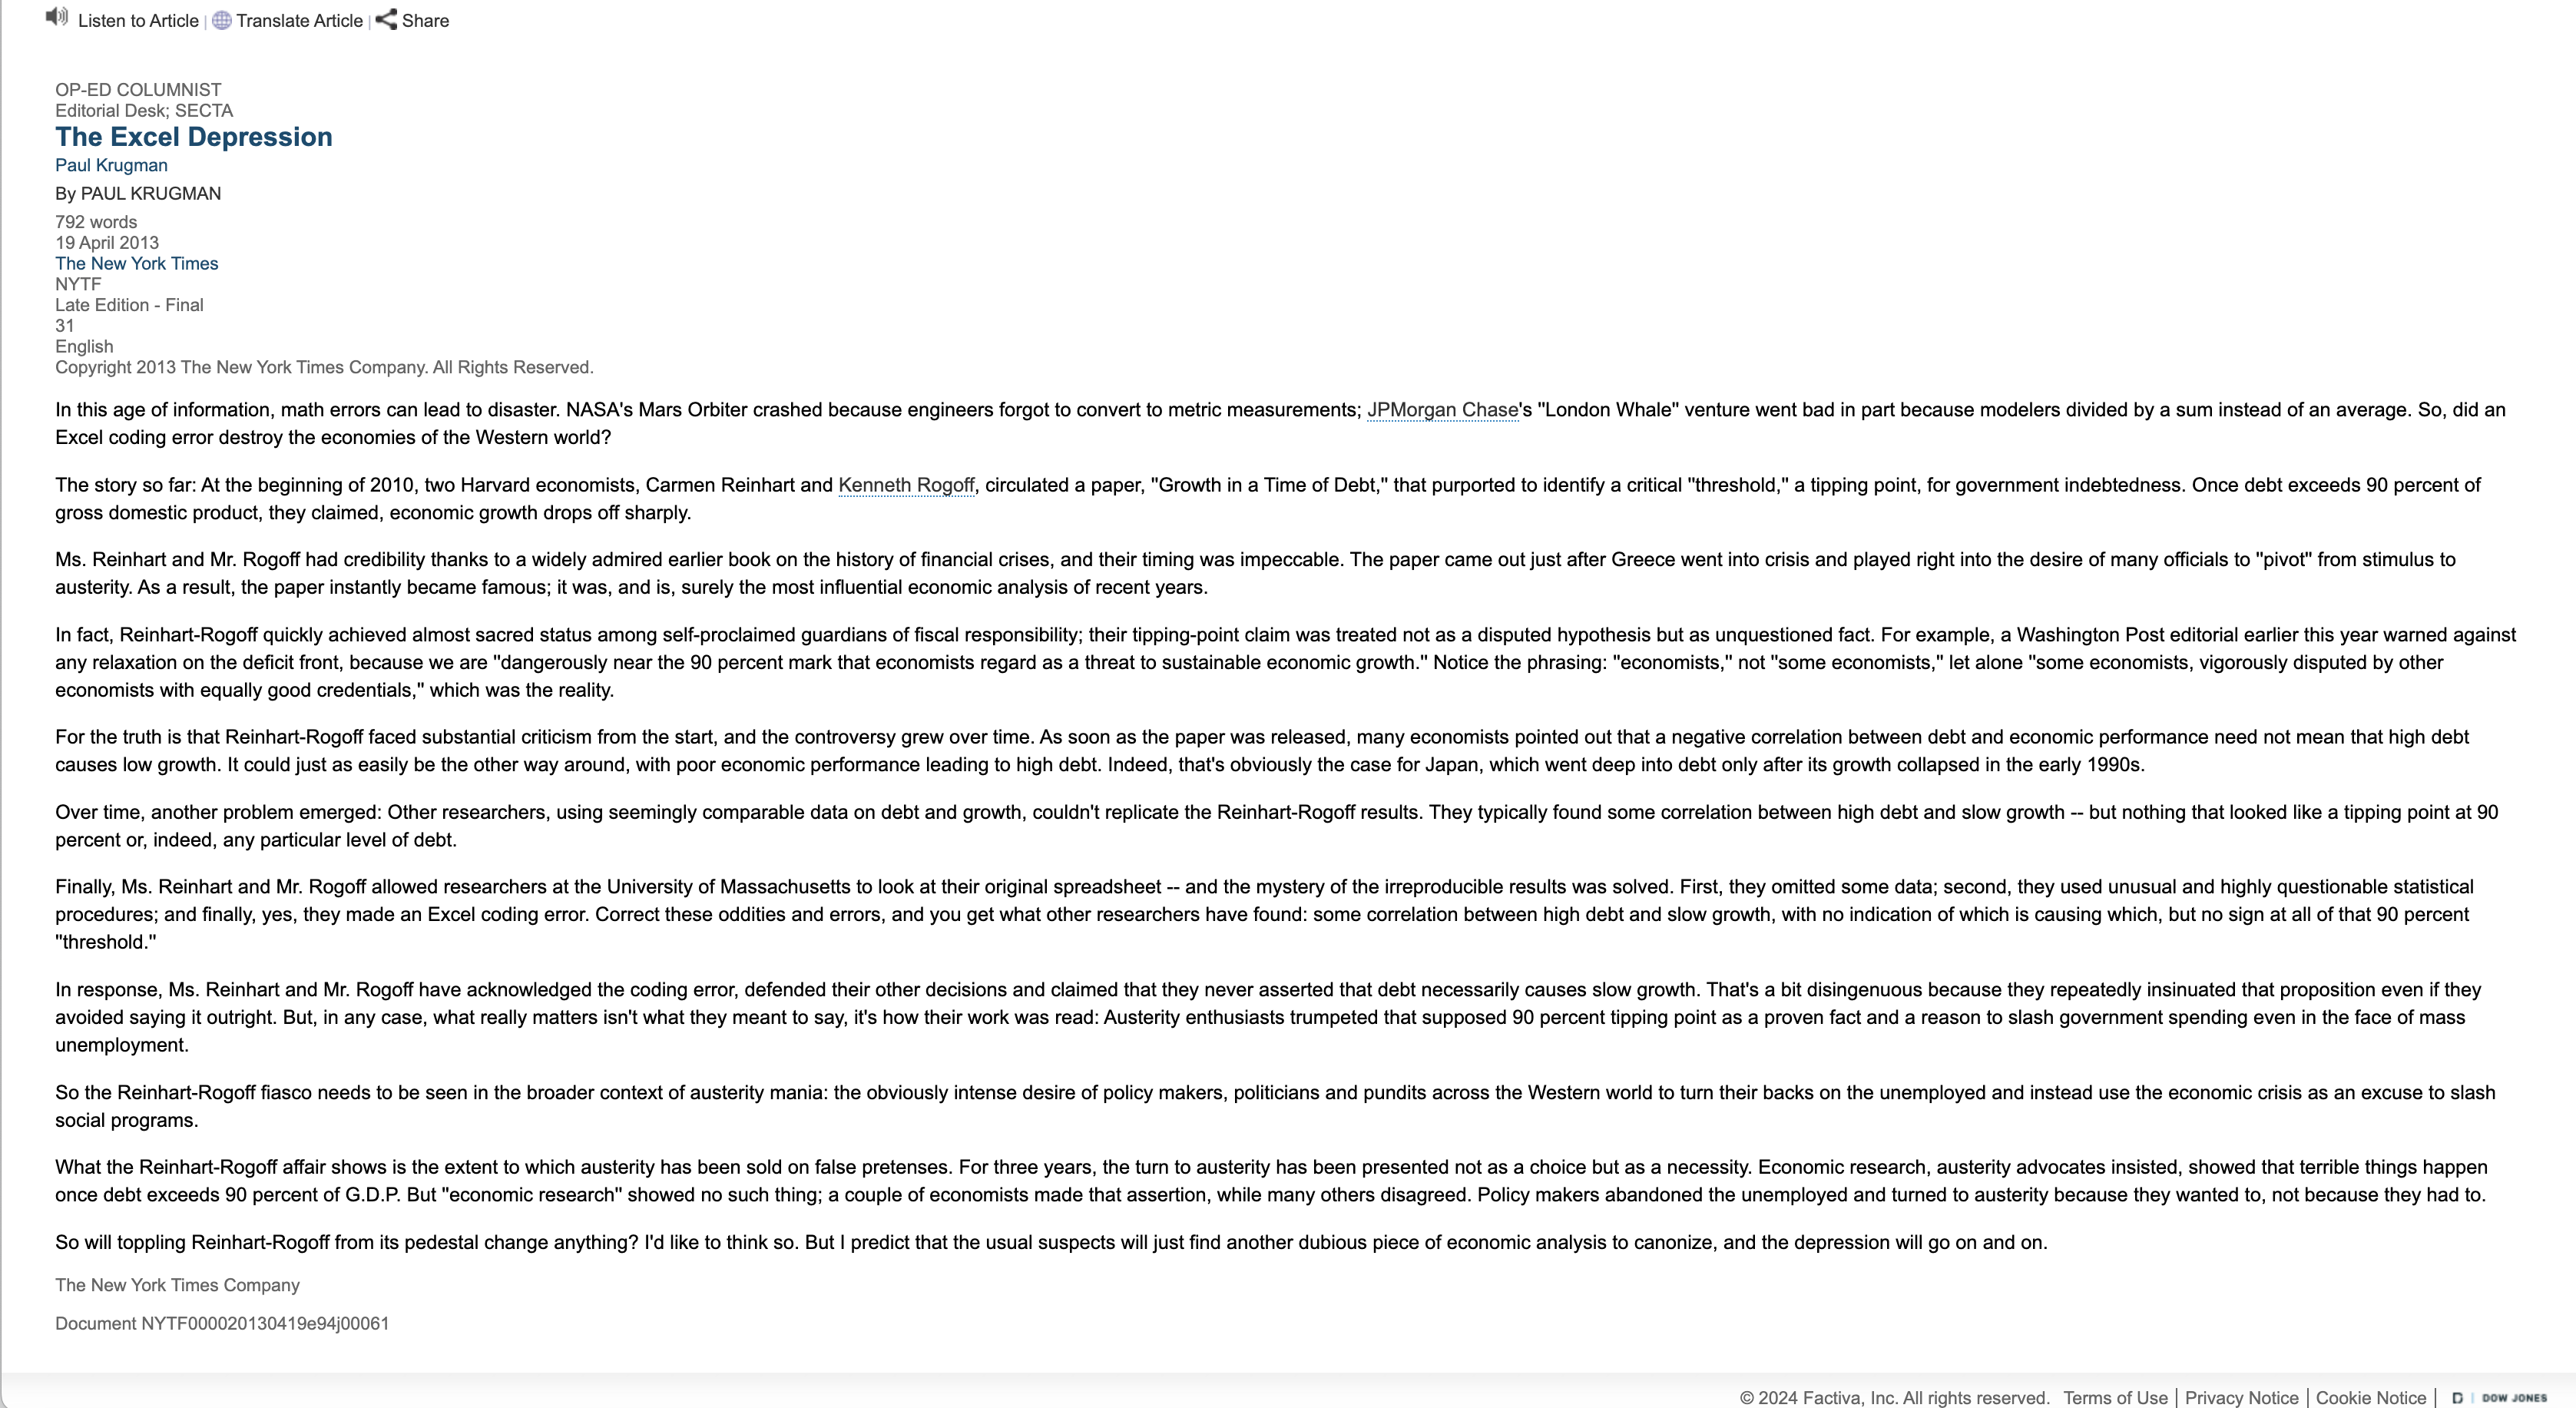
Source: (“The Excel Depression” 2013)
Reinhart-Rogoff spreadsheet error:
- Influential economics paper
- Original results showed average real economic growth slows (a 0.1% decline) when a country’s debt rises to more than 90% of gross domestic product
- Influenced austerity policies globally
- But, Excel formula excluded 5 rows (i.e 5 countries: Australia, Austria, Belgium, Canada and Denmark)
- Wrong conclusions about debt/GDP (when that error was corrected, the “0.1% decline” data became a 2.2% average increase in economic growth)
Lesson: Always check your formulas!
Horror Story #4: The London Whale
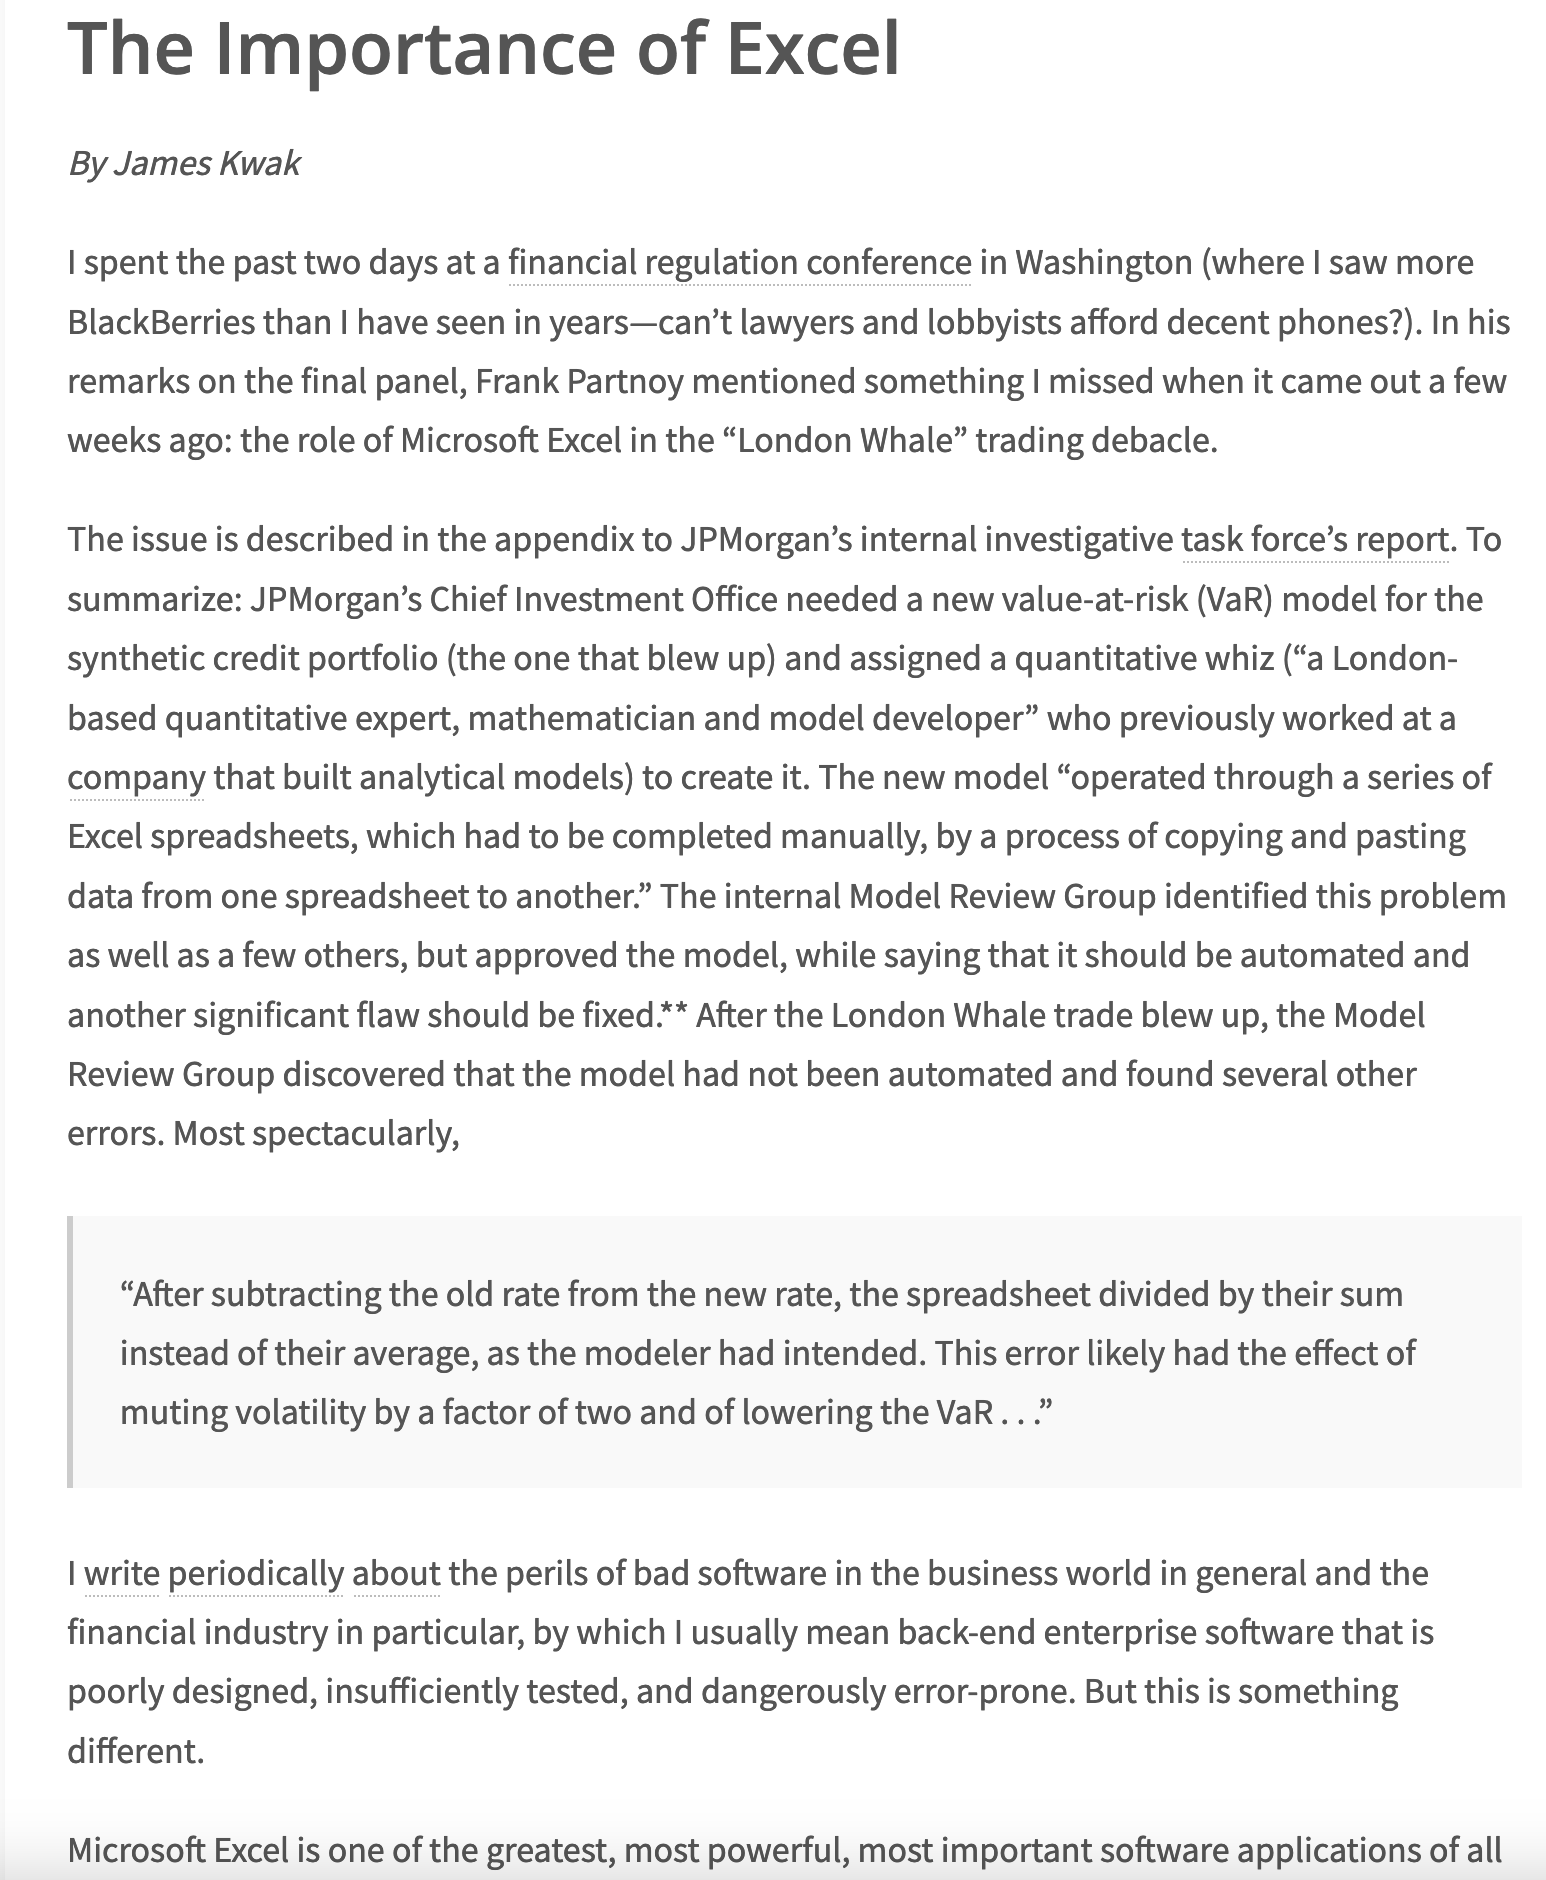
Source: (Kwak 2013)
Horror Story #4: The London Whale
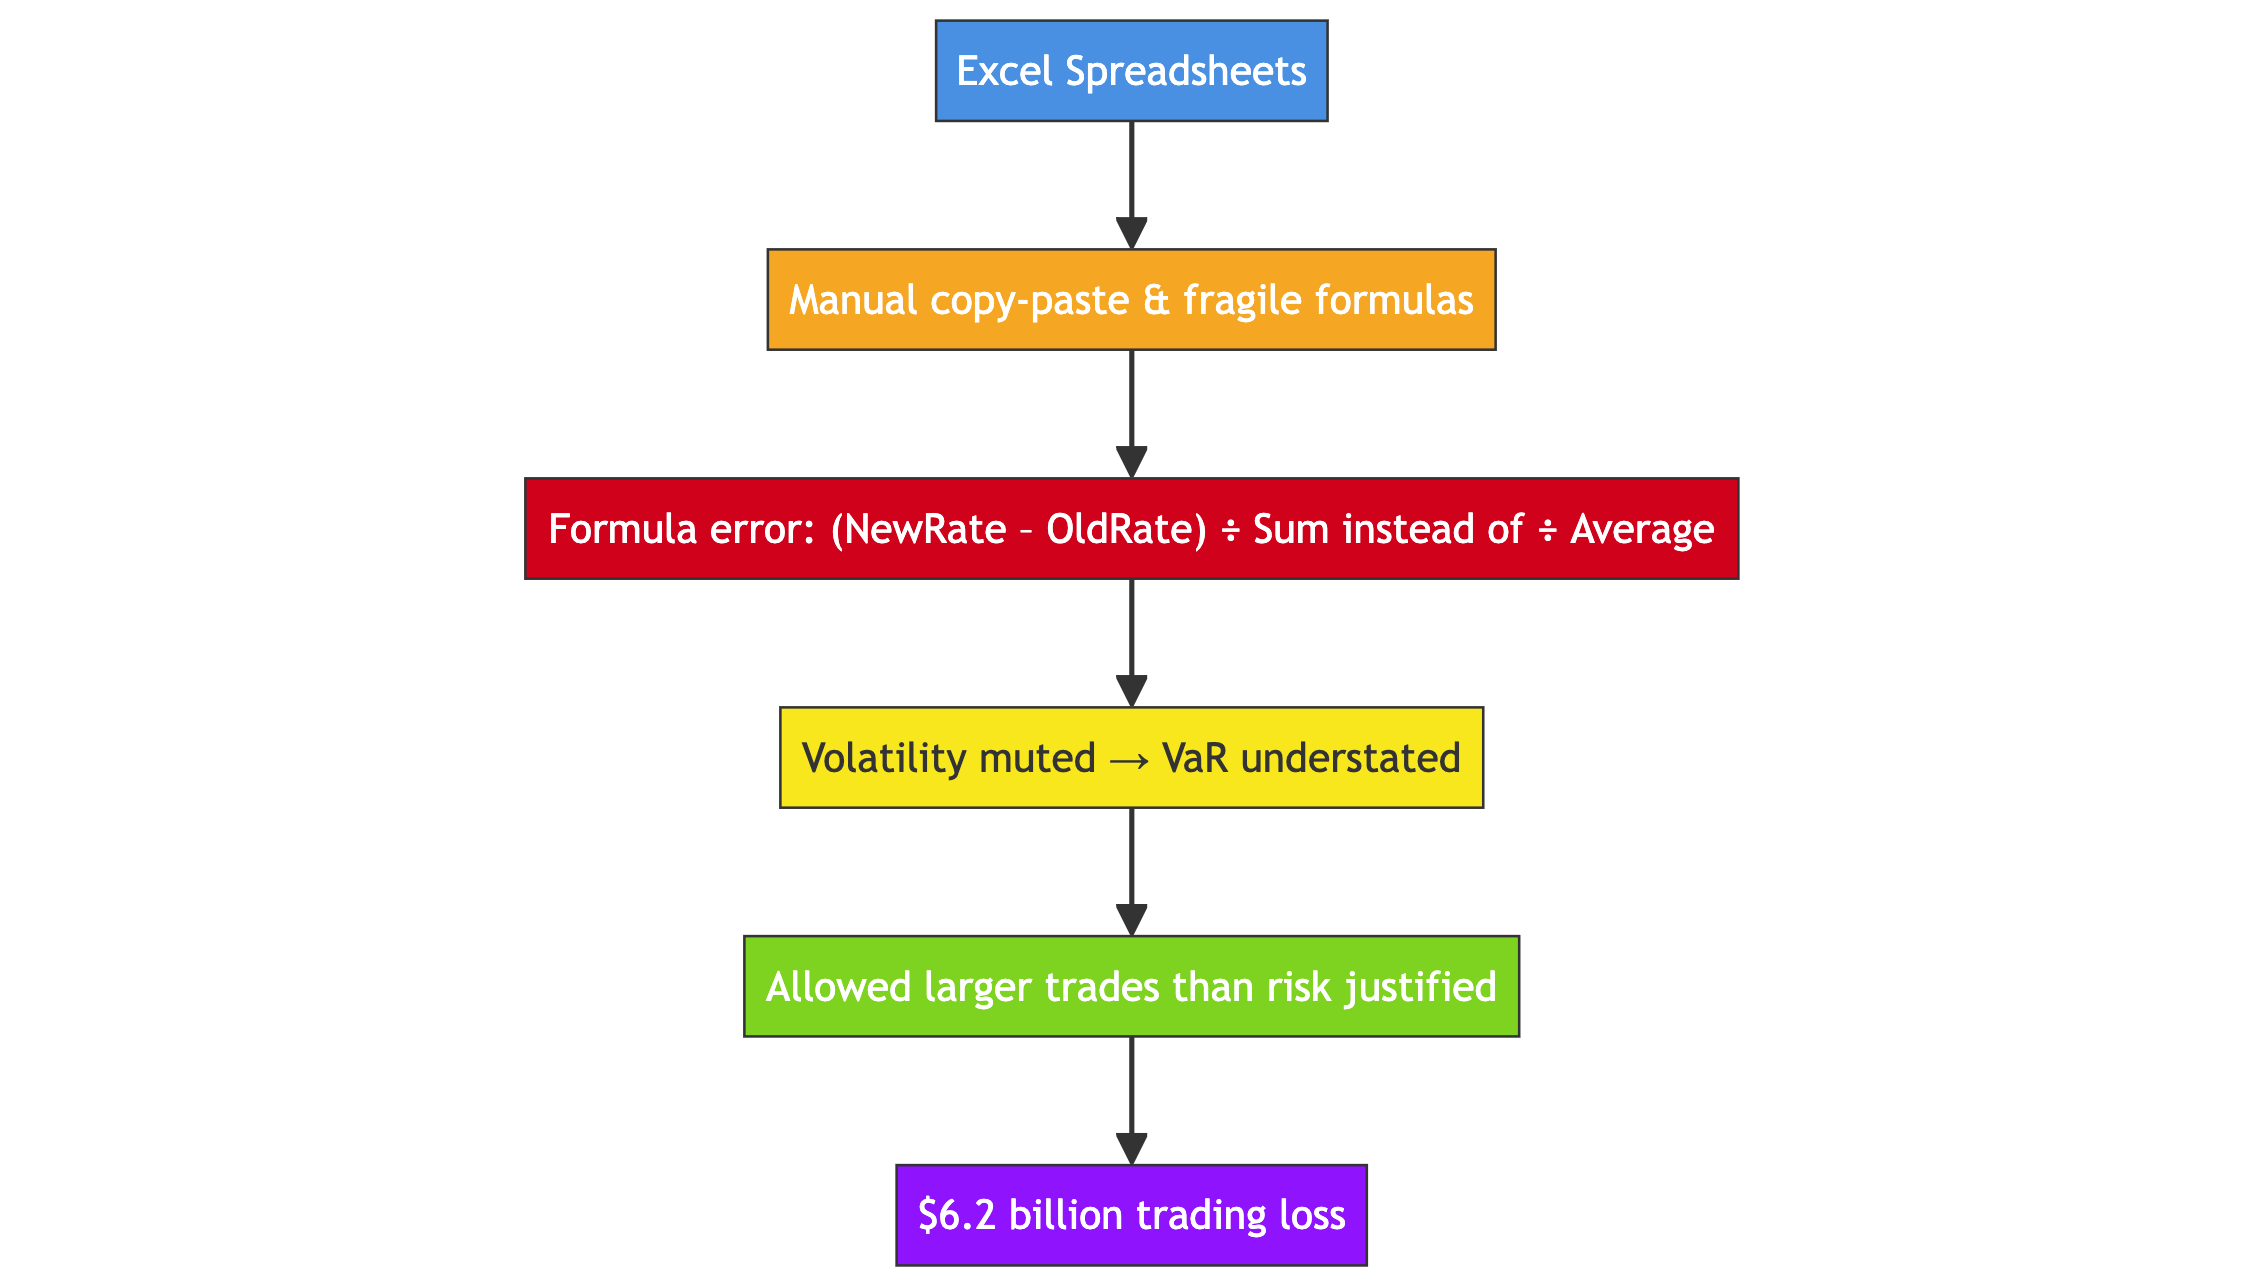
JP Morgan VaR Model (2012)
- Built entirely in Excel
- Manual copy-paste & fragile formulas
- Formula error: divided by sum instead of average → VaR understated
- Model review flagged issues but flaws never fixed
- Resulted in $6.2 billion trading loss
Lesson:
Even sophisticated financial models fail on fragile, manually managed software. Critical calculations need robust, auditable systems.
Horror Story #5: Microsoft and Finance

Source: (Beales 2013)
A pattern of Excel-related failures:
2007 CPDOs (i.e Constant proportion debt obligations): Moody’s coding error inflated structured finance ratings (pre-crisis)
2012 London Whale: JPMorgan’s Excel-based risk model failures ($6.2B loss)
2013 Reinhart-Rogoff: Spreadsheet error undermined influential austerity research
The pattern: Office tools used as substitutes for proper systems and critical thinking
The Excel Takeaway
Excel is NOT for:
- Serious data science
- Reproducible analysis
- Large-scale data processing
- Production systems
Excel IS fine for:
- Quick data exploration
- Small personal datasets
- Initial data entry
- Simple calculations
Just know its limitations!
Two Aspects of Computational Thinking
1️⃣ Designing computations (thinking like a computer)
- Input: numbers, symbols, lists
- Output: a solution
- Computation: deterministic calculations & symbolic manipulation
- Example: sorting a list, calculating shortest paths
2️⃣ Explaining and interpreting the world (modeling complexity)
- Example: Schelling’s segregation model 🏘️ (McCown 2014)
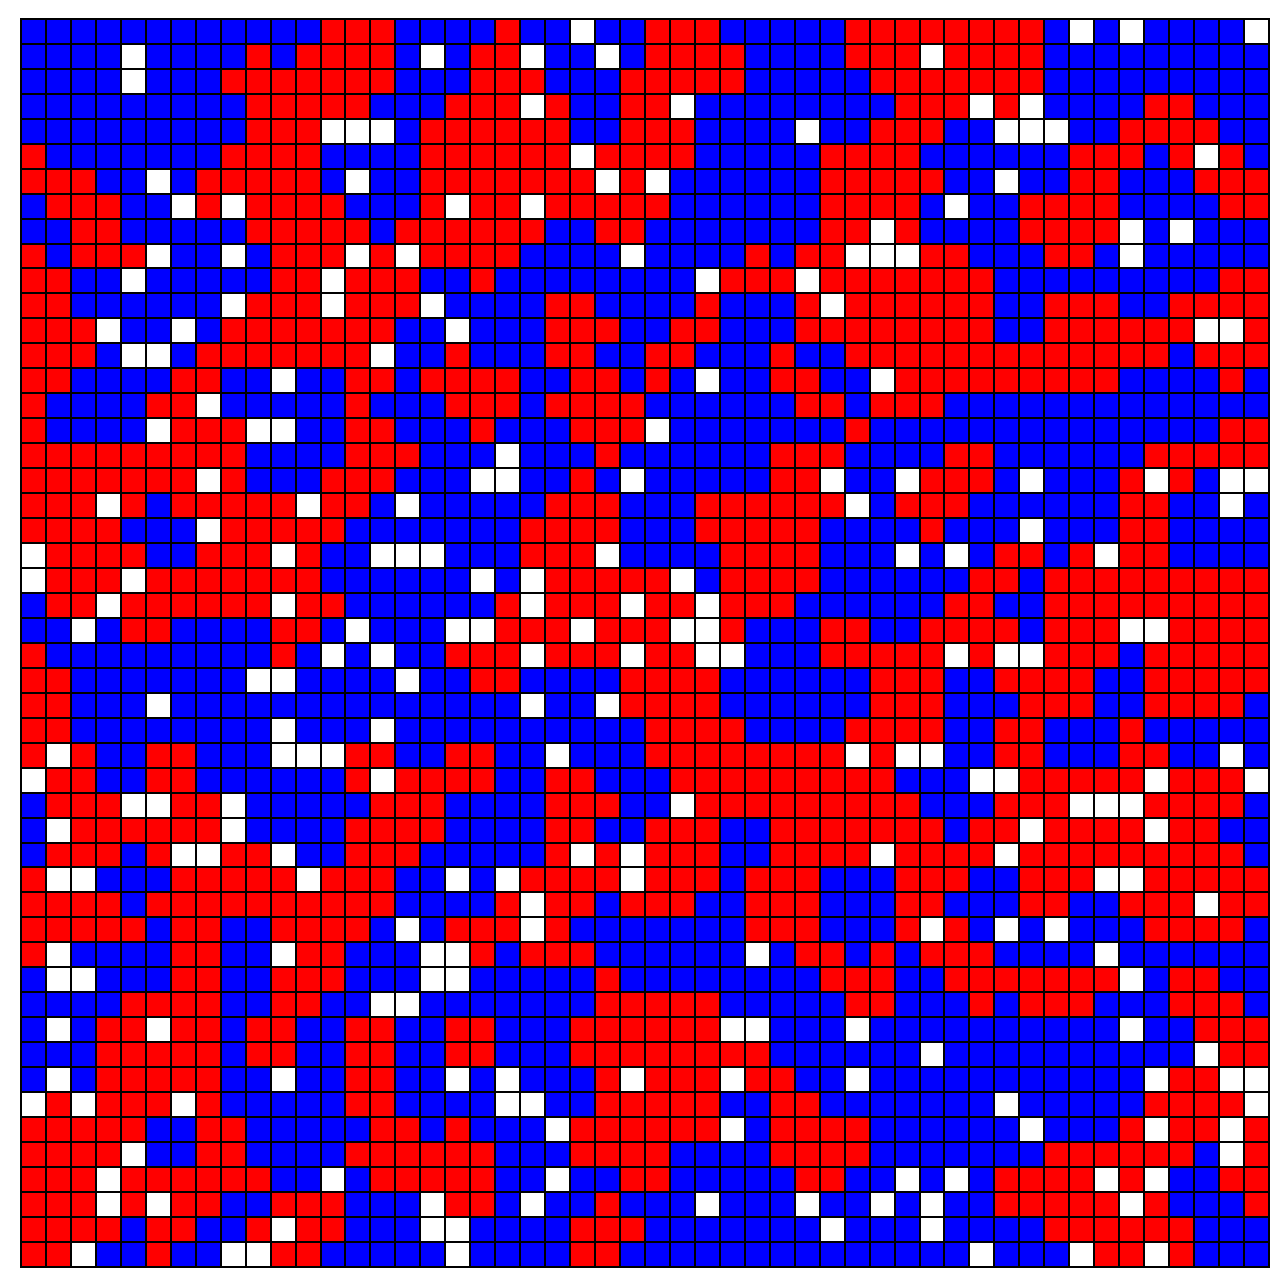
💬 Discussion Prompt:
- “What patterns do you think emerge if residents move when unhappy?”
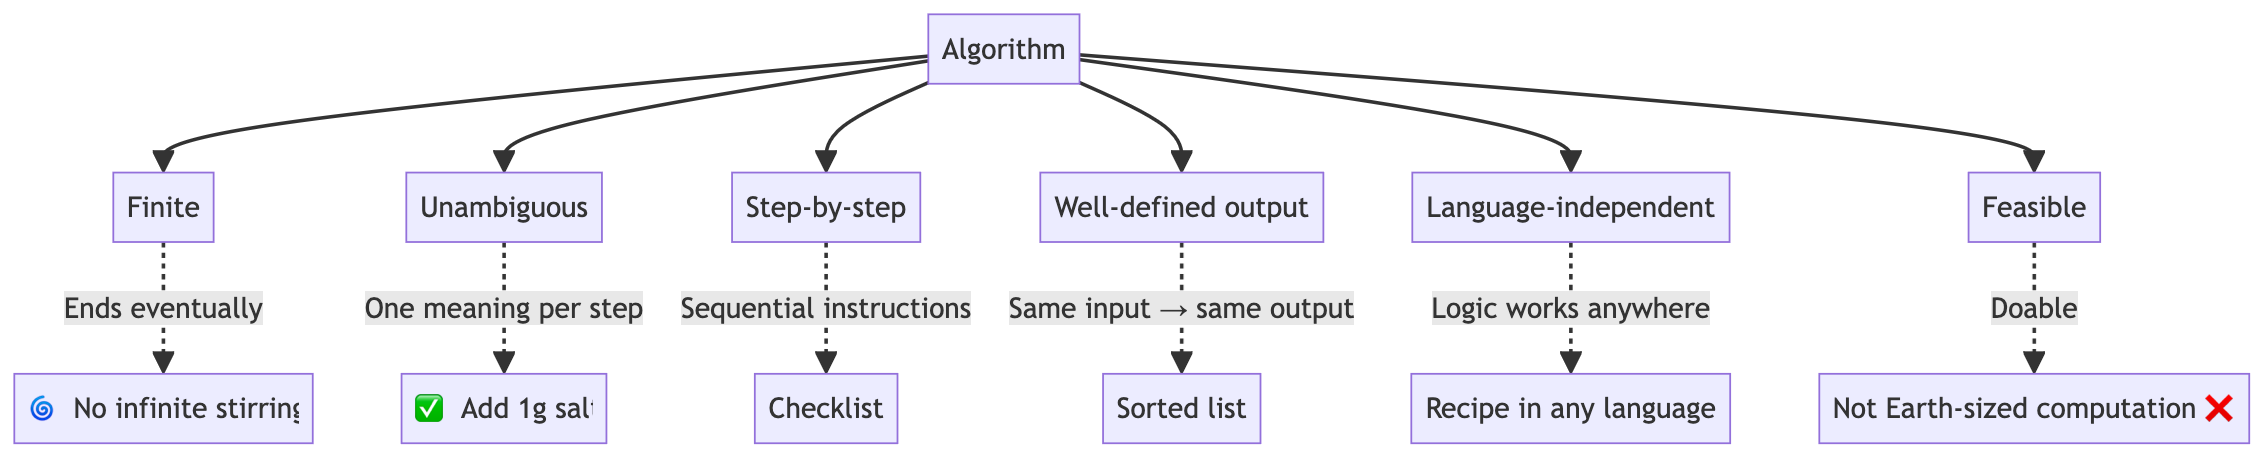
What is an algorithm? 📊
Definition:
- A recipe for solving a problem in a finite, step-by-step, unambiguous way

Properties:
Time for a break 🍵

After the break:
- Other algorithm examples
Time to look at another example of algorithm
Scenario: Campus walk from Marshall Building to other locations
Graph (distances in meters):
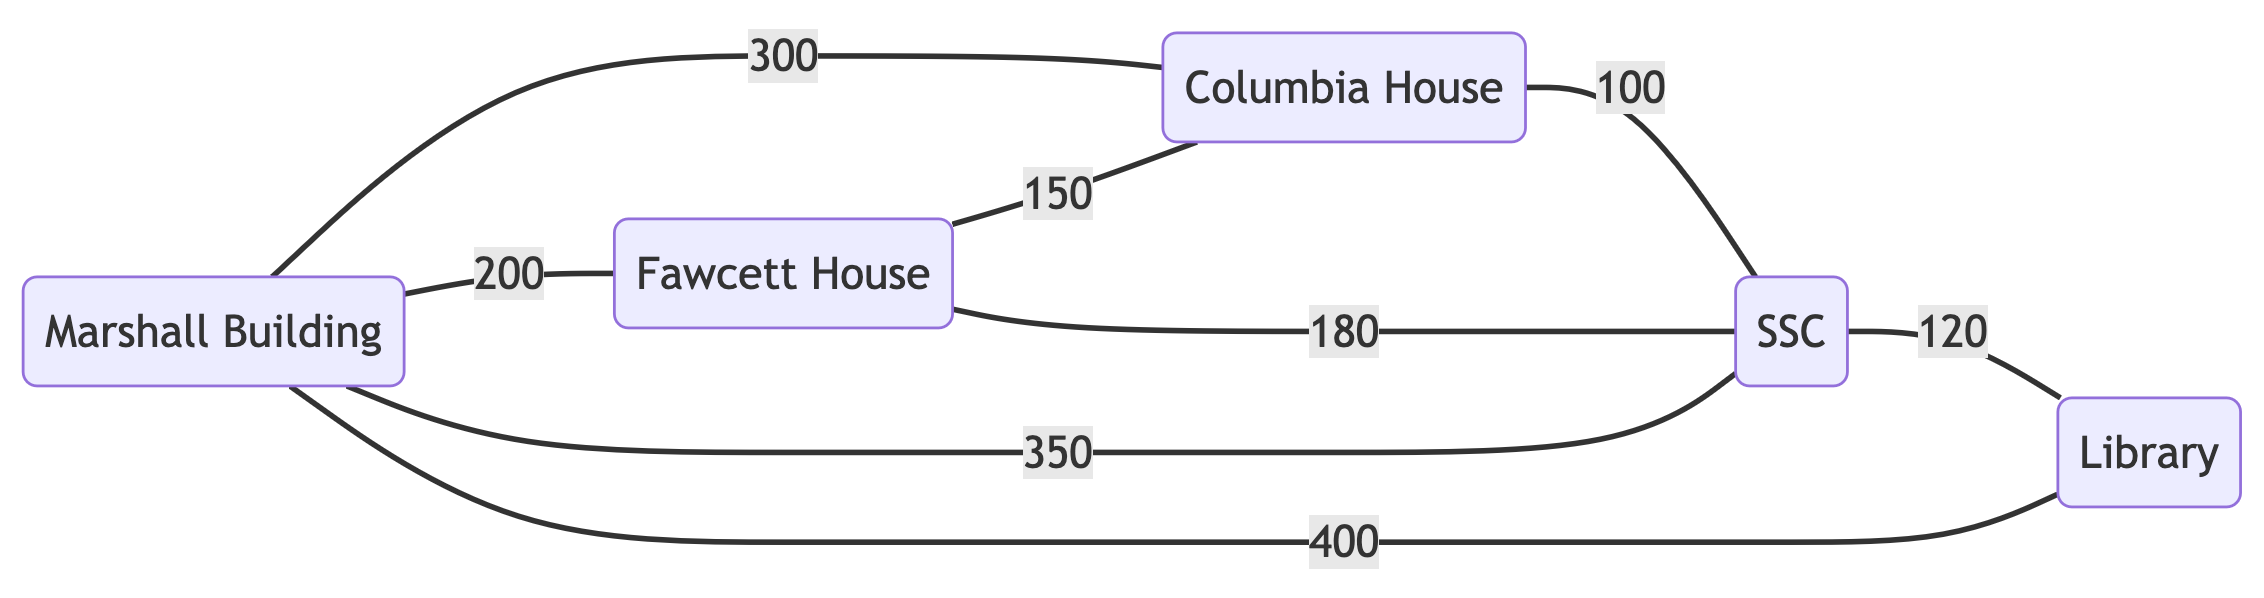
Discovery:
- Could you try and find the shortest path from Marshall → all other nodes?