🗓️ Week 02
Basic blocks of data: getting familiar with the most common data types and file formats
DS101 – Fundamentals of Data Science
06 Oct 2025
Quick announcements

Sign in here
Important
🥐 Important releases this week
Your first summative is now available!
Deadline: Week 04 class (October 21st)
Real Dataset Example
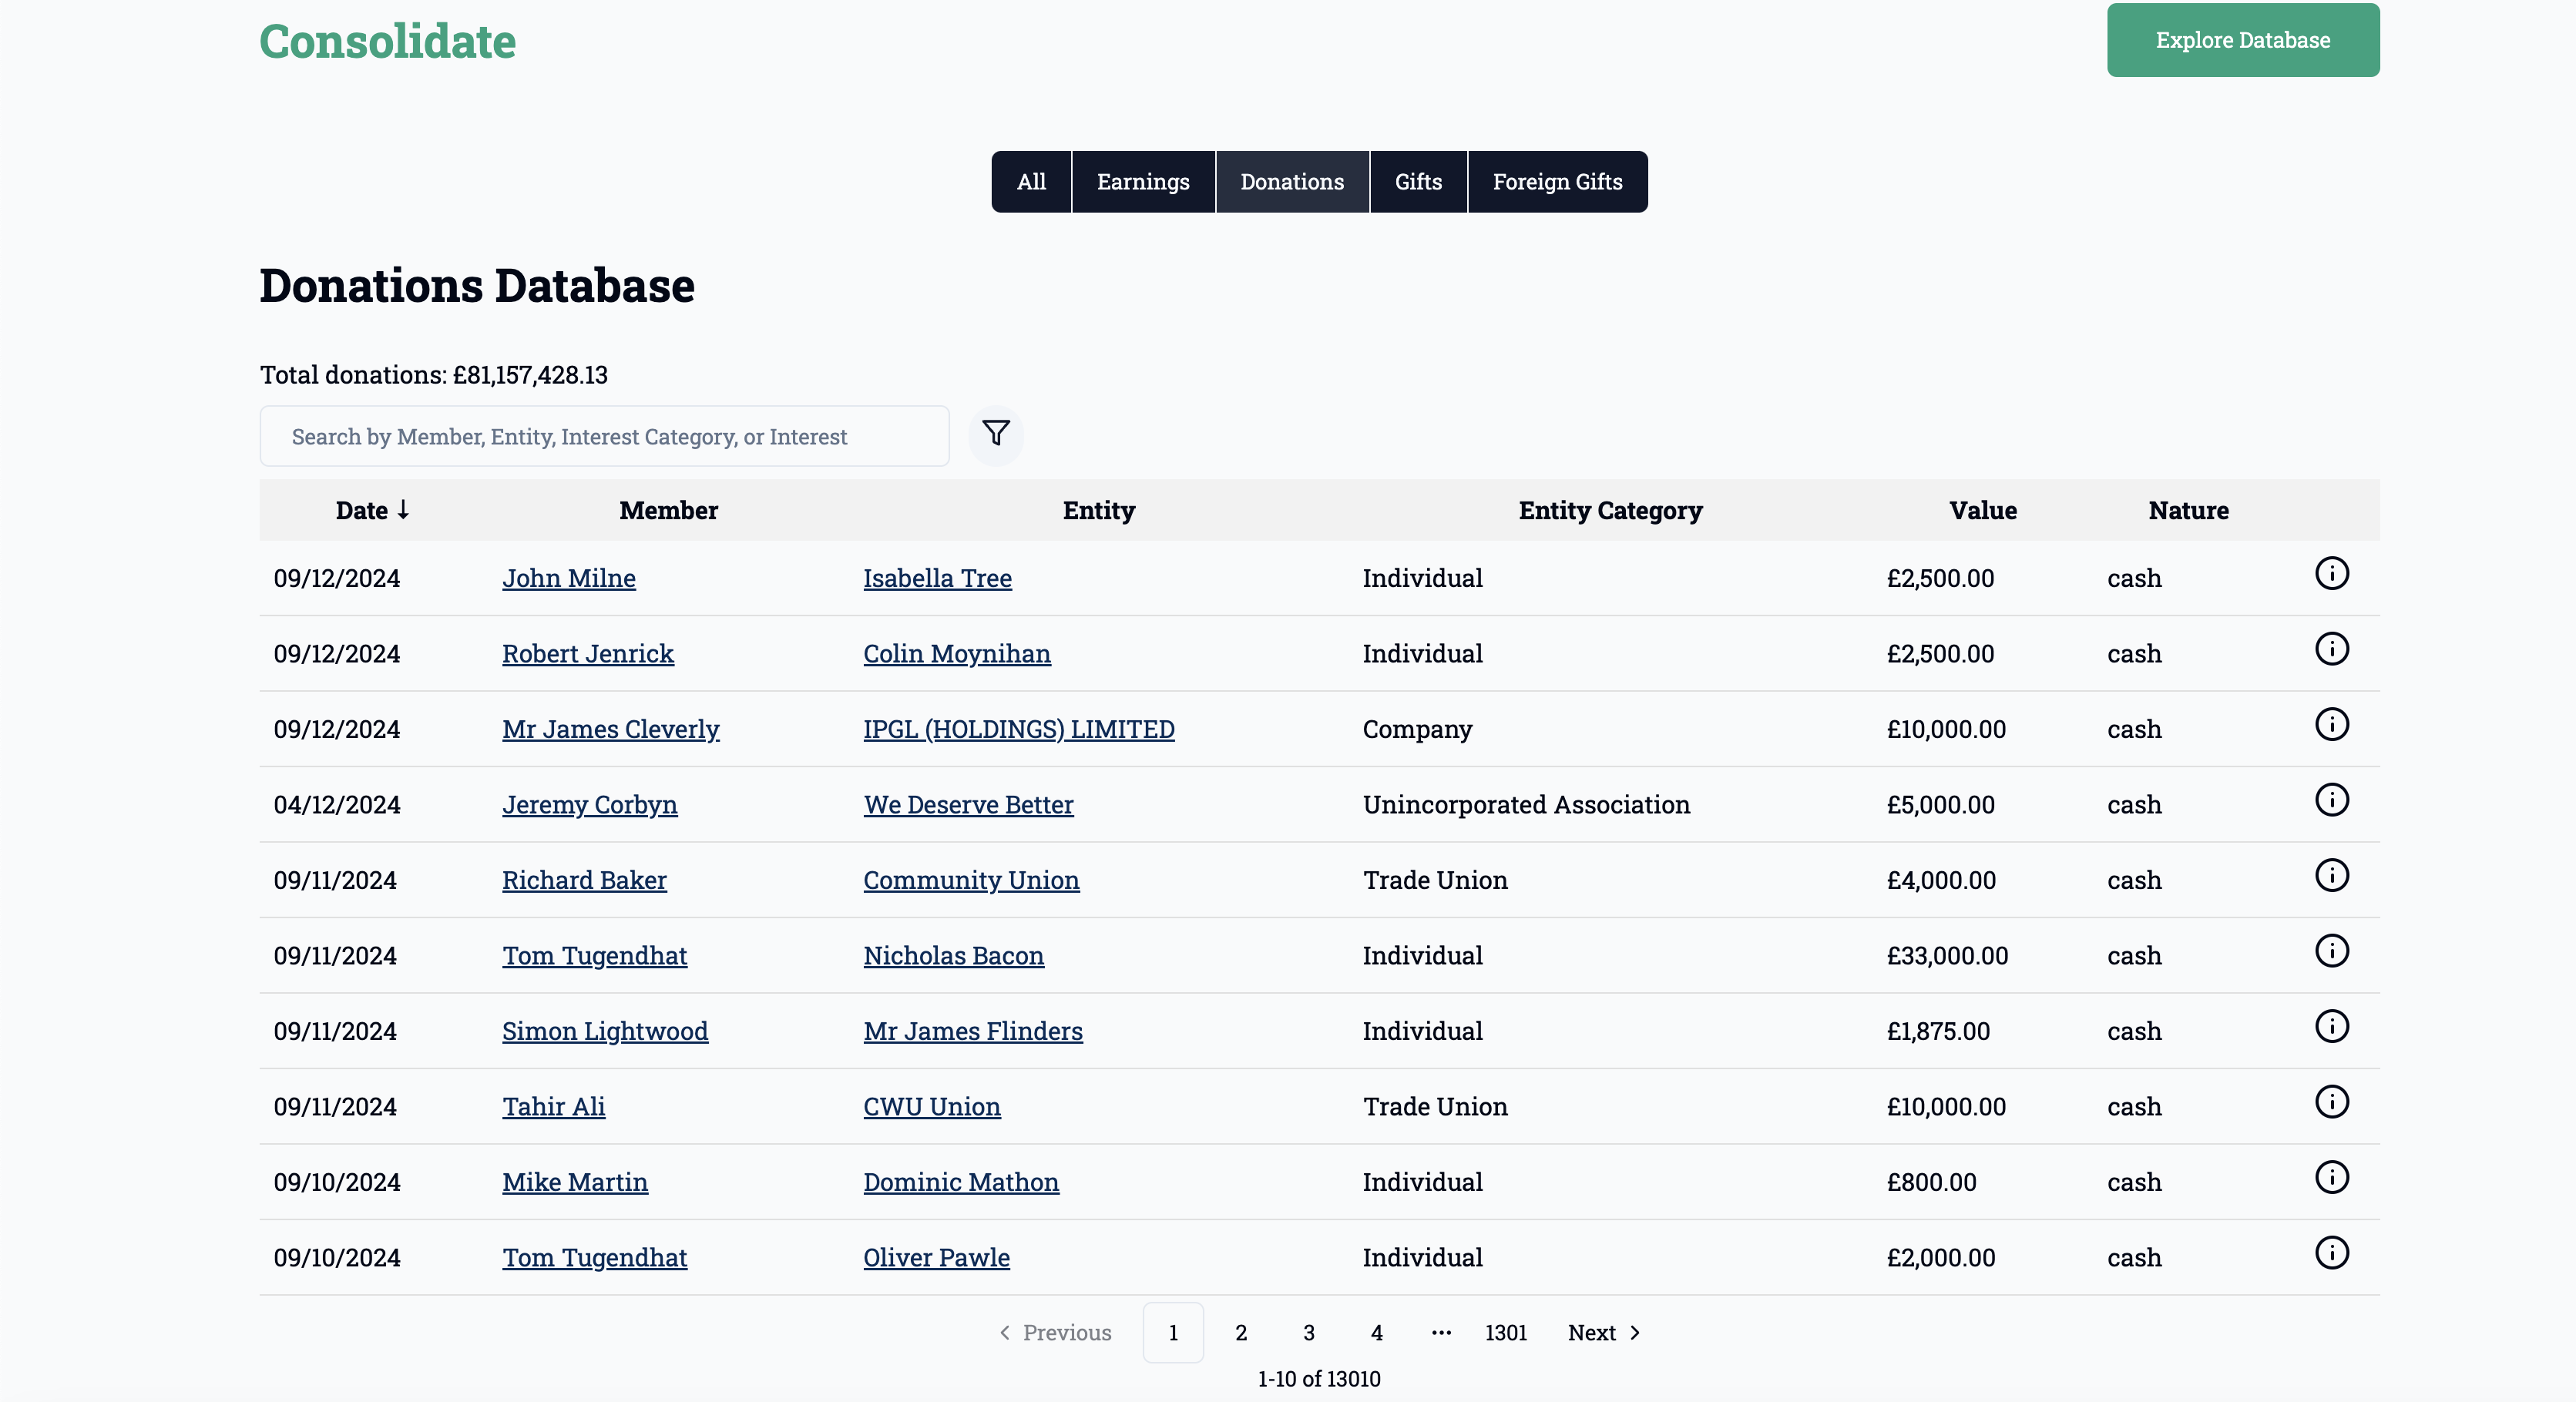
UK MP Donations Database - A real-world example we’ll explore today
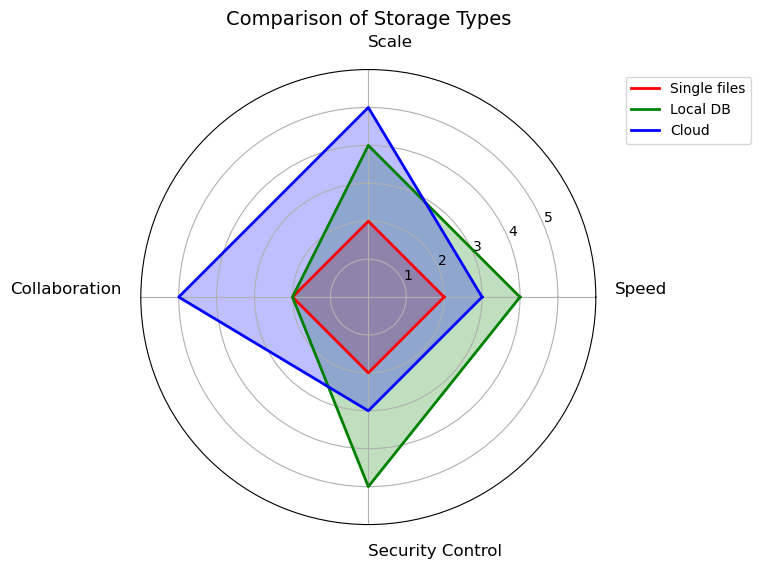
Storage Options
When Numbers Hit Their Limits
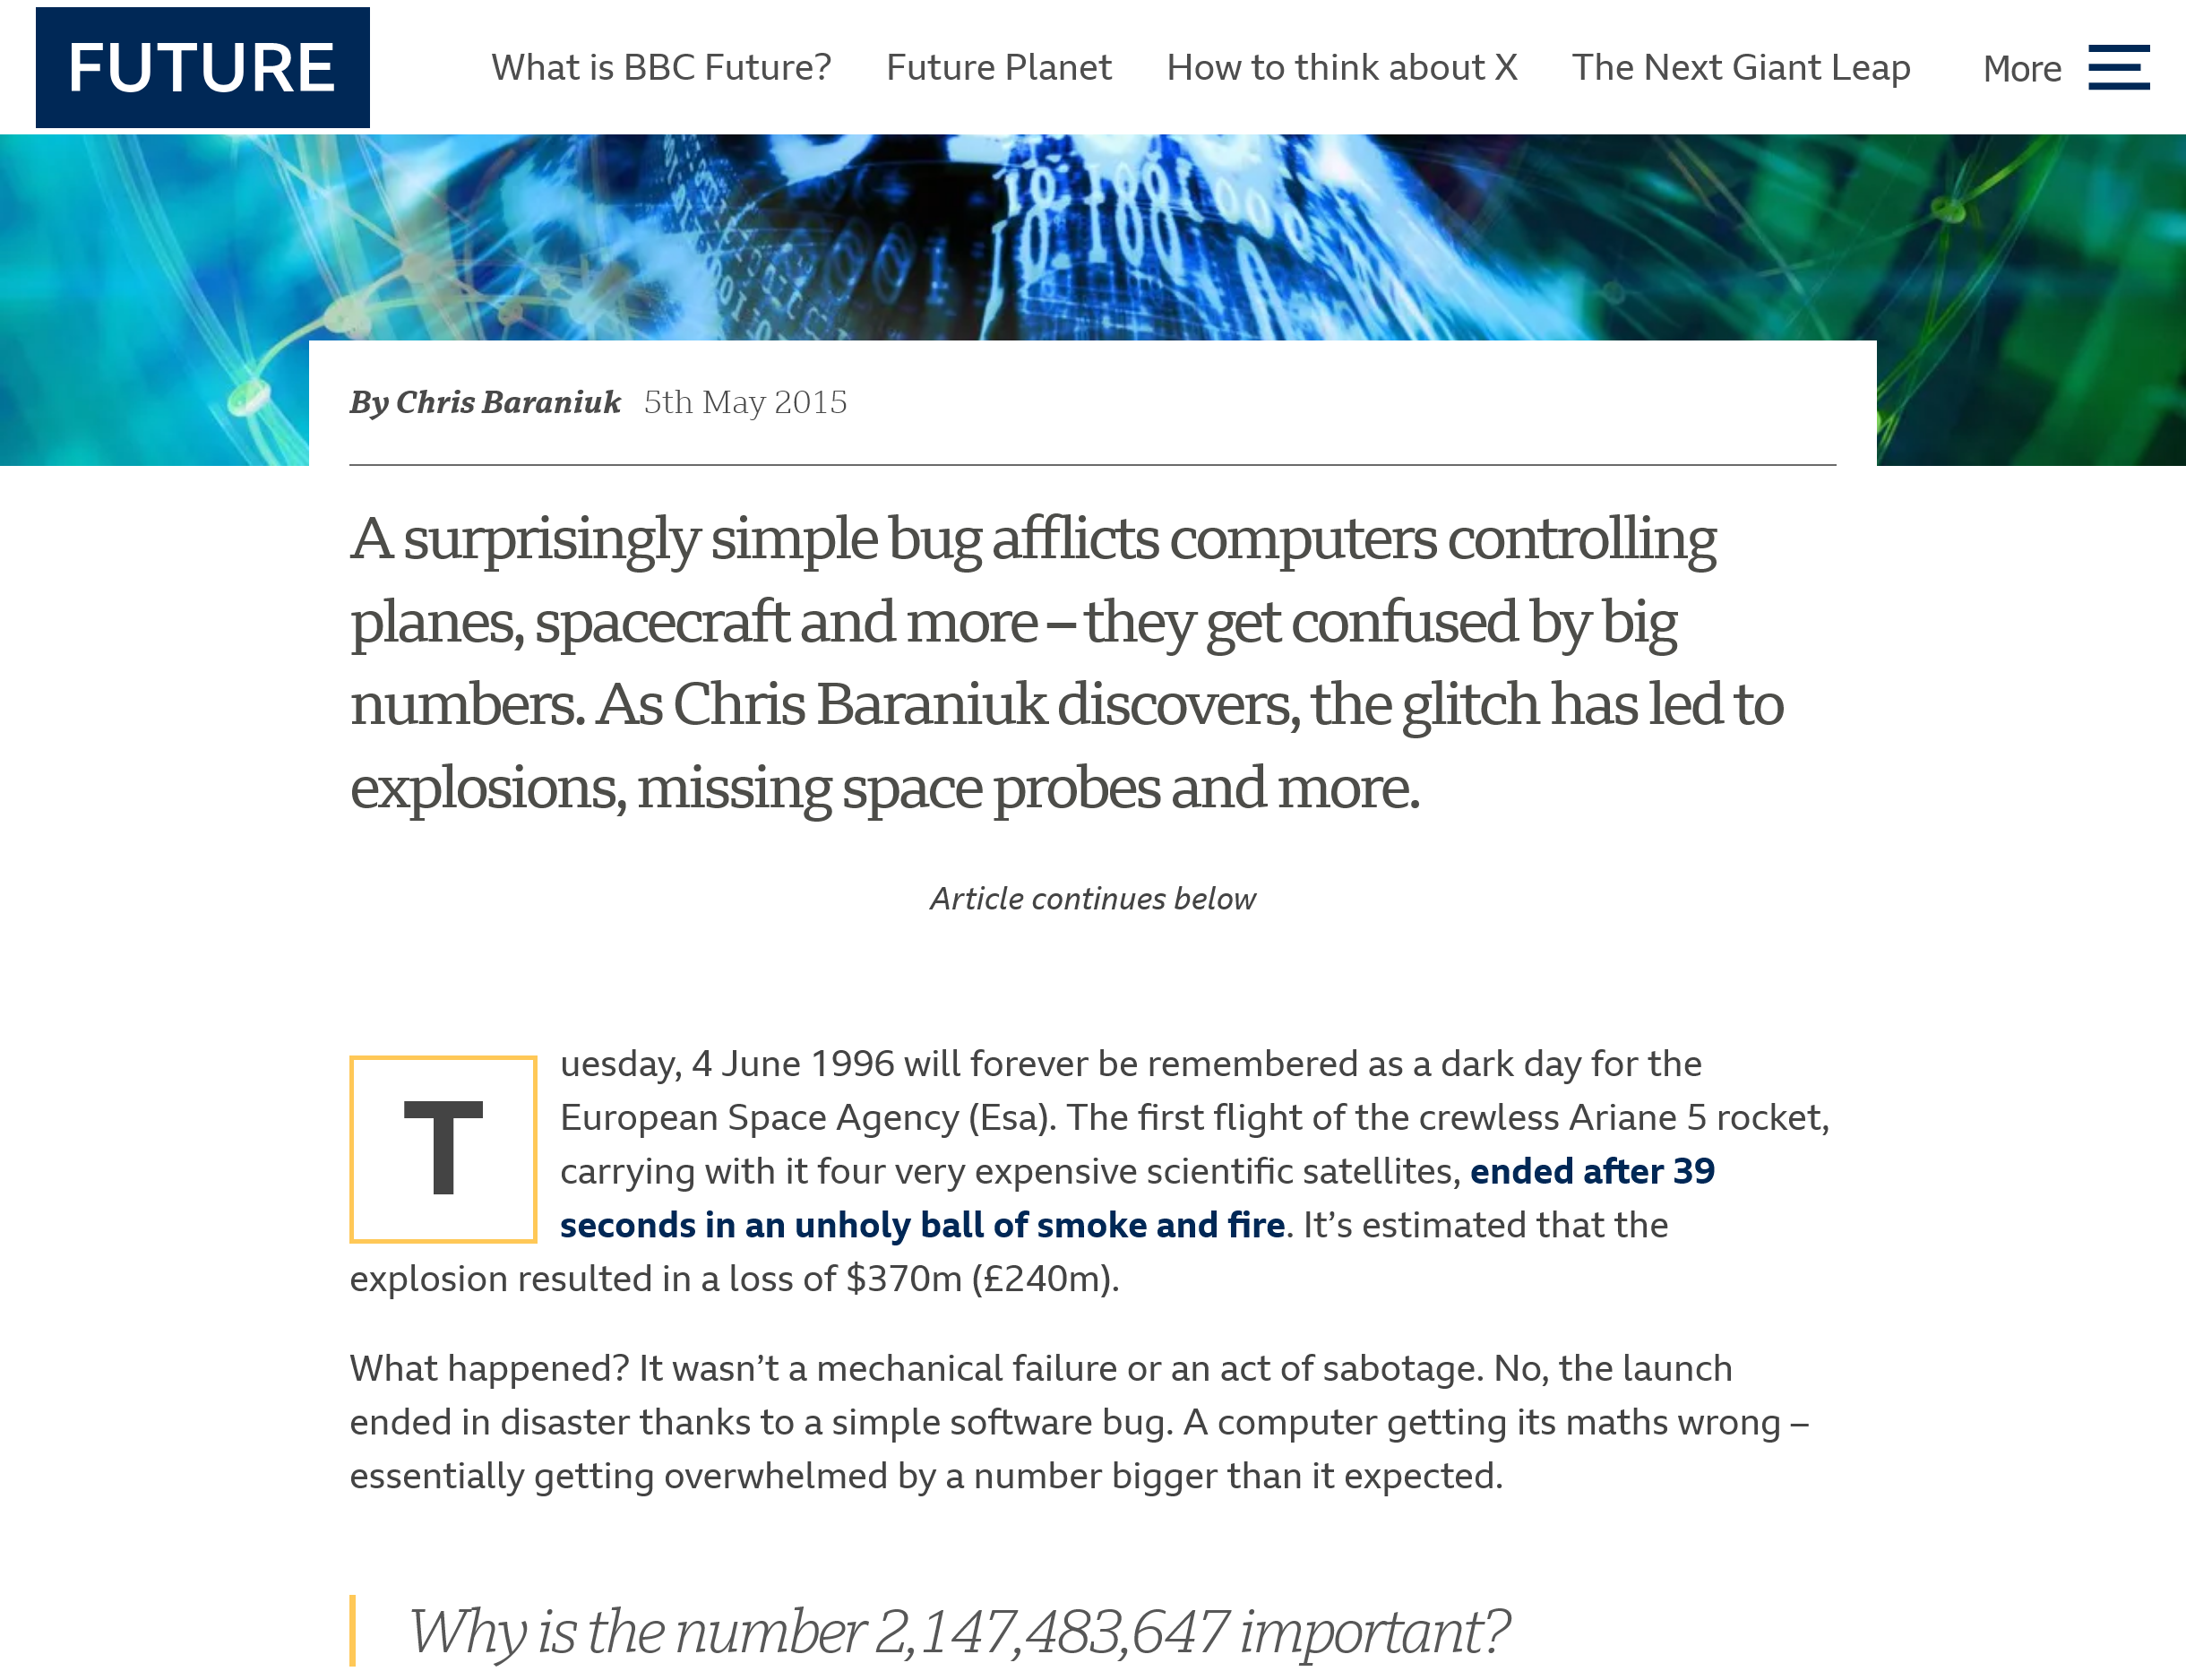
Source: (Baraniuk 2015)
Ariane 5 Rocket (1996):
- Horizontal velocity calculated as 64-bit number
- Converted to 16-bit signed integer → overflow
- Guidance system crashed 39s after launch
- Cost: rocket exploded, $370 million loss
- Video explanation
When Numbers Hit Their Limits
Source: (Baraniuk 2015)
Boeing 787 Dreamliner (2015):
- Engine control uptime stored as 32-bit signed integer (hundredths of a second)
- After 248 days → counter reached max (2,147,483,647) → failsafe triggered
- Engines could automatically shut down
- Mitigation: periodic reboots and software fix
When Numbers Hit Their Limits
Source: (Baraniuk 2015)
Patriot Missile System (1991):
- Clock measured in tenths of seconds, converted to floating-point
- Small rounding errors accumulated over 100+ hours
- Mis-tracked incoming Scud missile
- Consequence: missile hit US Army barracks, 28 killed, 98 injured
When Numbers Hit Their Limits
Source: (Baraniuk 2015)
Key lessons:
- Data type limits can crash systems or cause critical errors
- Overflow or precision drift is subtle but dangerous
- Design for scale, and monitor counters/precision closely
Gangnam Style Breaks YouTube

Source: (BBC News 2014)
What happened (2014):
- YouTube view counter: 32-bit signed integer
- Maximum: 2,147,483,647 views
- Gangnam Style exceeded this
- Counter displayed negative values!
YouTube’s fix:
- Upgraded to 64-bit integers
- New maximum: 9,223,372,036,854,775,807
- (Over 9 quintillion views)
Key lessons:
- Design systems for unexpected scale
- Monitor approaching limits
- Plan for growth beyond estimates
- Users notice when counters break!
ASCII Art: When Text Becomes Visual

      |\      _,,,---,,_
ZZZzz /,`.-'`'    -.  ;-;;,_
     |,4-  ) )-,_. ,\ (  `'-'
    '---''(_/--'  `-'\_)
Sleeping cat by Felix Lee
  ;)( ;
 :----:     o8Oo./
C|====| ._o8o8o8Oo_.
 |    |  \========/
 `----'   `------'
Coffee by Hayley Jane Wakenshaw
Emojis Are Text Too! 😊
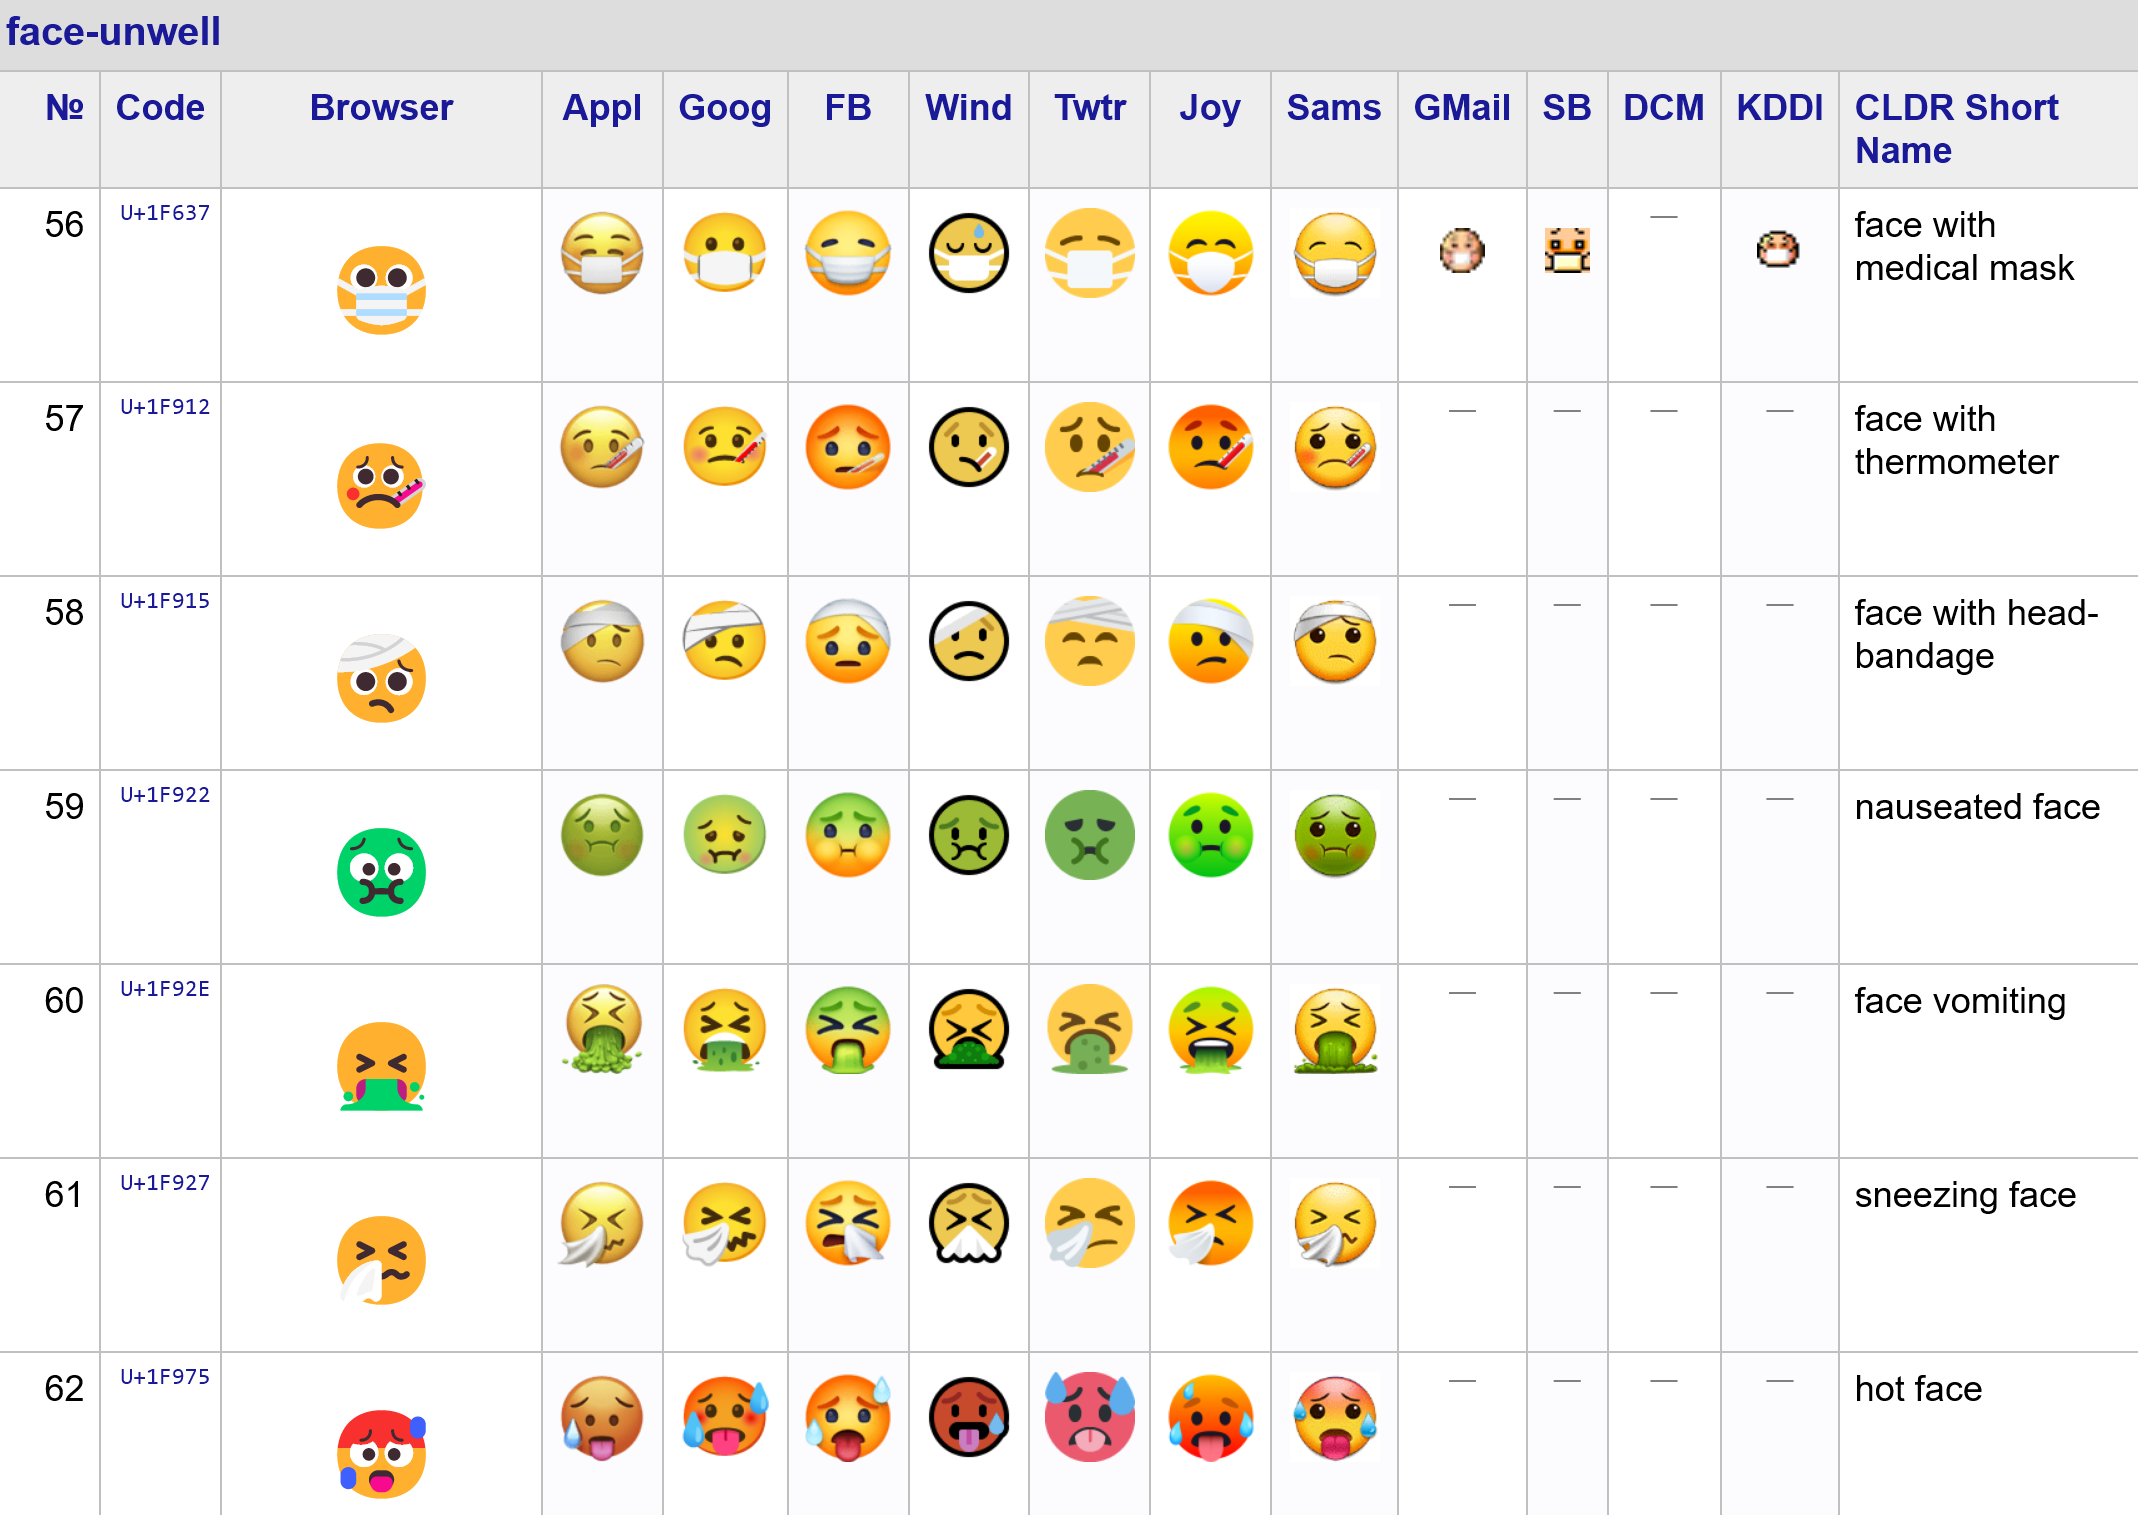
Emojis are part of the UTF-8 standard and can be used in data analysis!
Emojis in Data Science
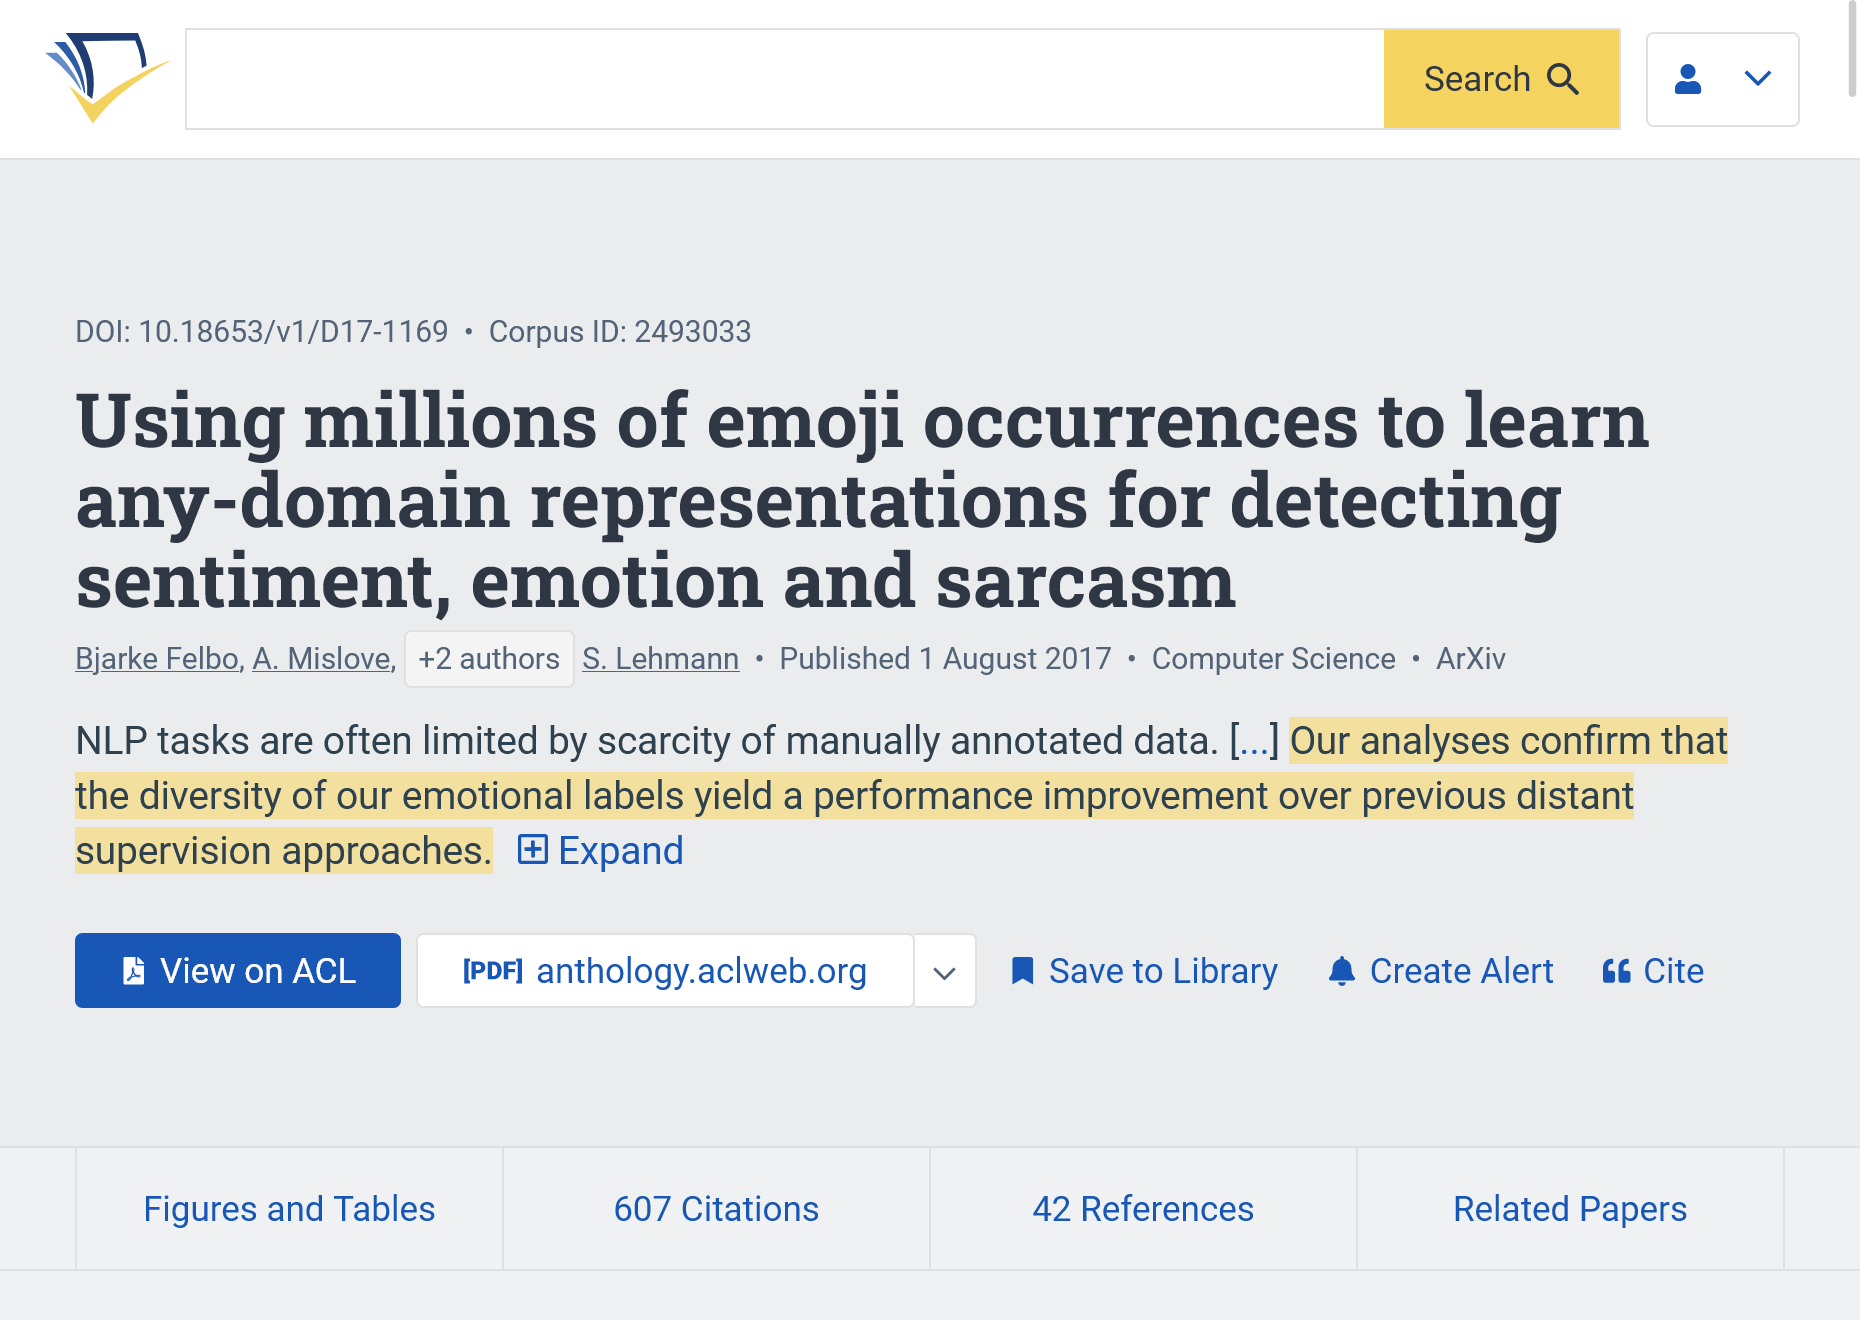
Reference: (Felbo et al. 2017)
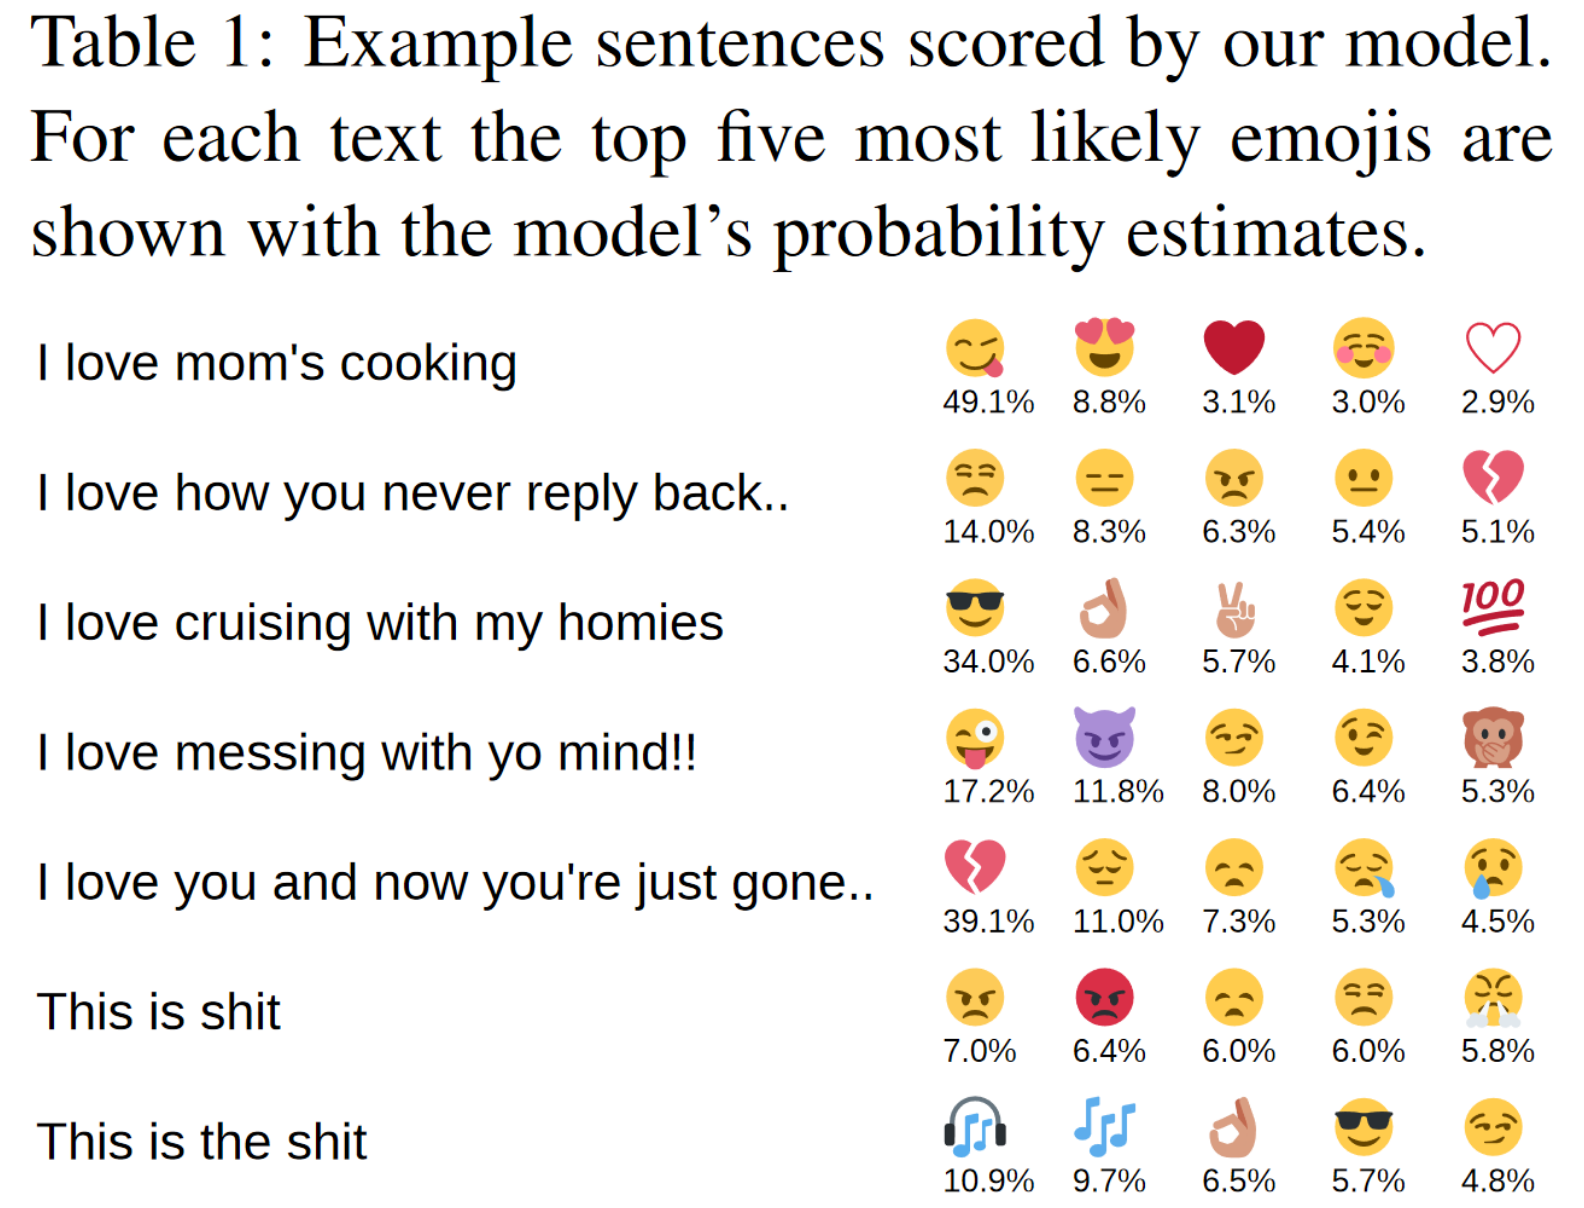
Research shows emojis improve sentiment analysis accuracy!
The Y2K Problem

Reference: (Oren 2019)
The issue:
- Dates stored as
YYnotYYYY 31/12/99→01/01/00- Is that 1900 or 2000?
The result:
- Billions spent on fixes
- Global panic (largely avoided due to preparation)
More on the topic:
The Next Date Crisis: Y2038
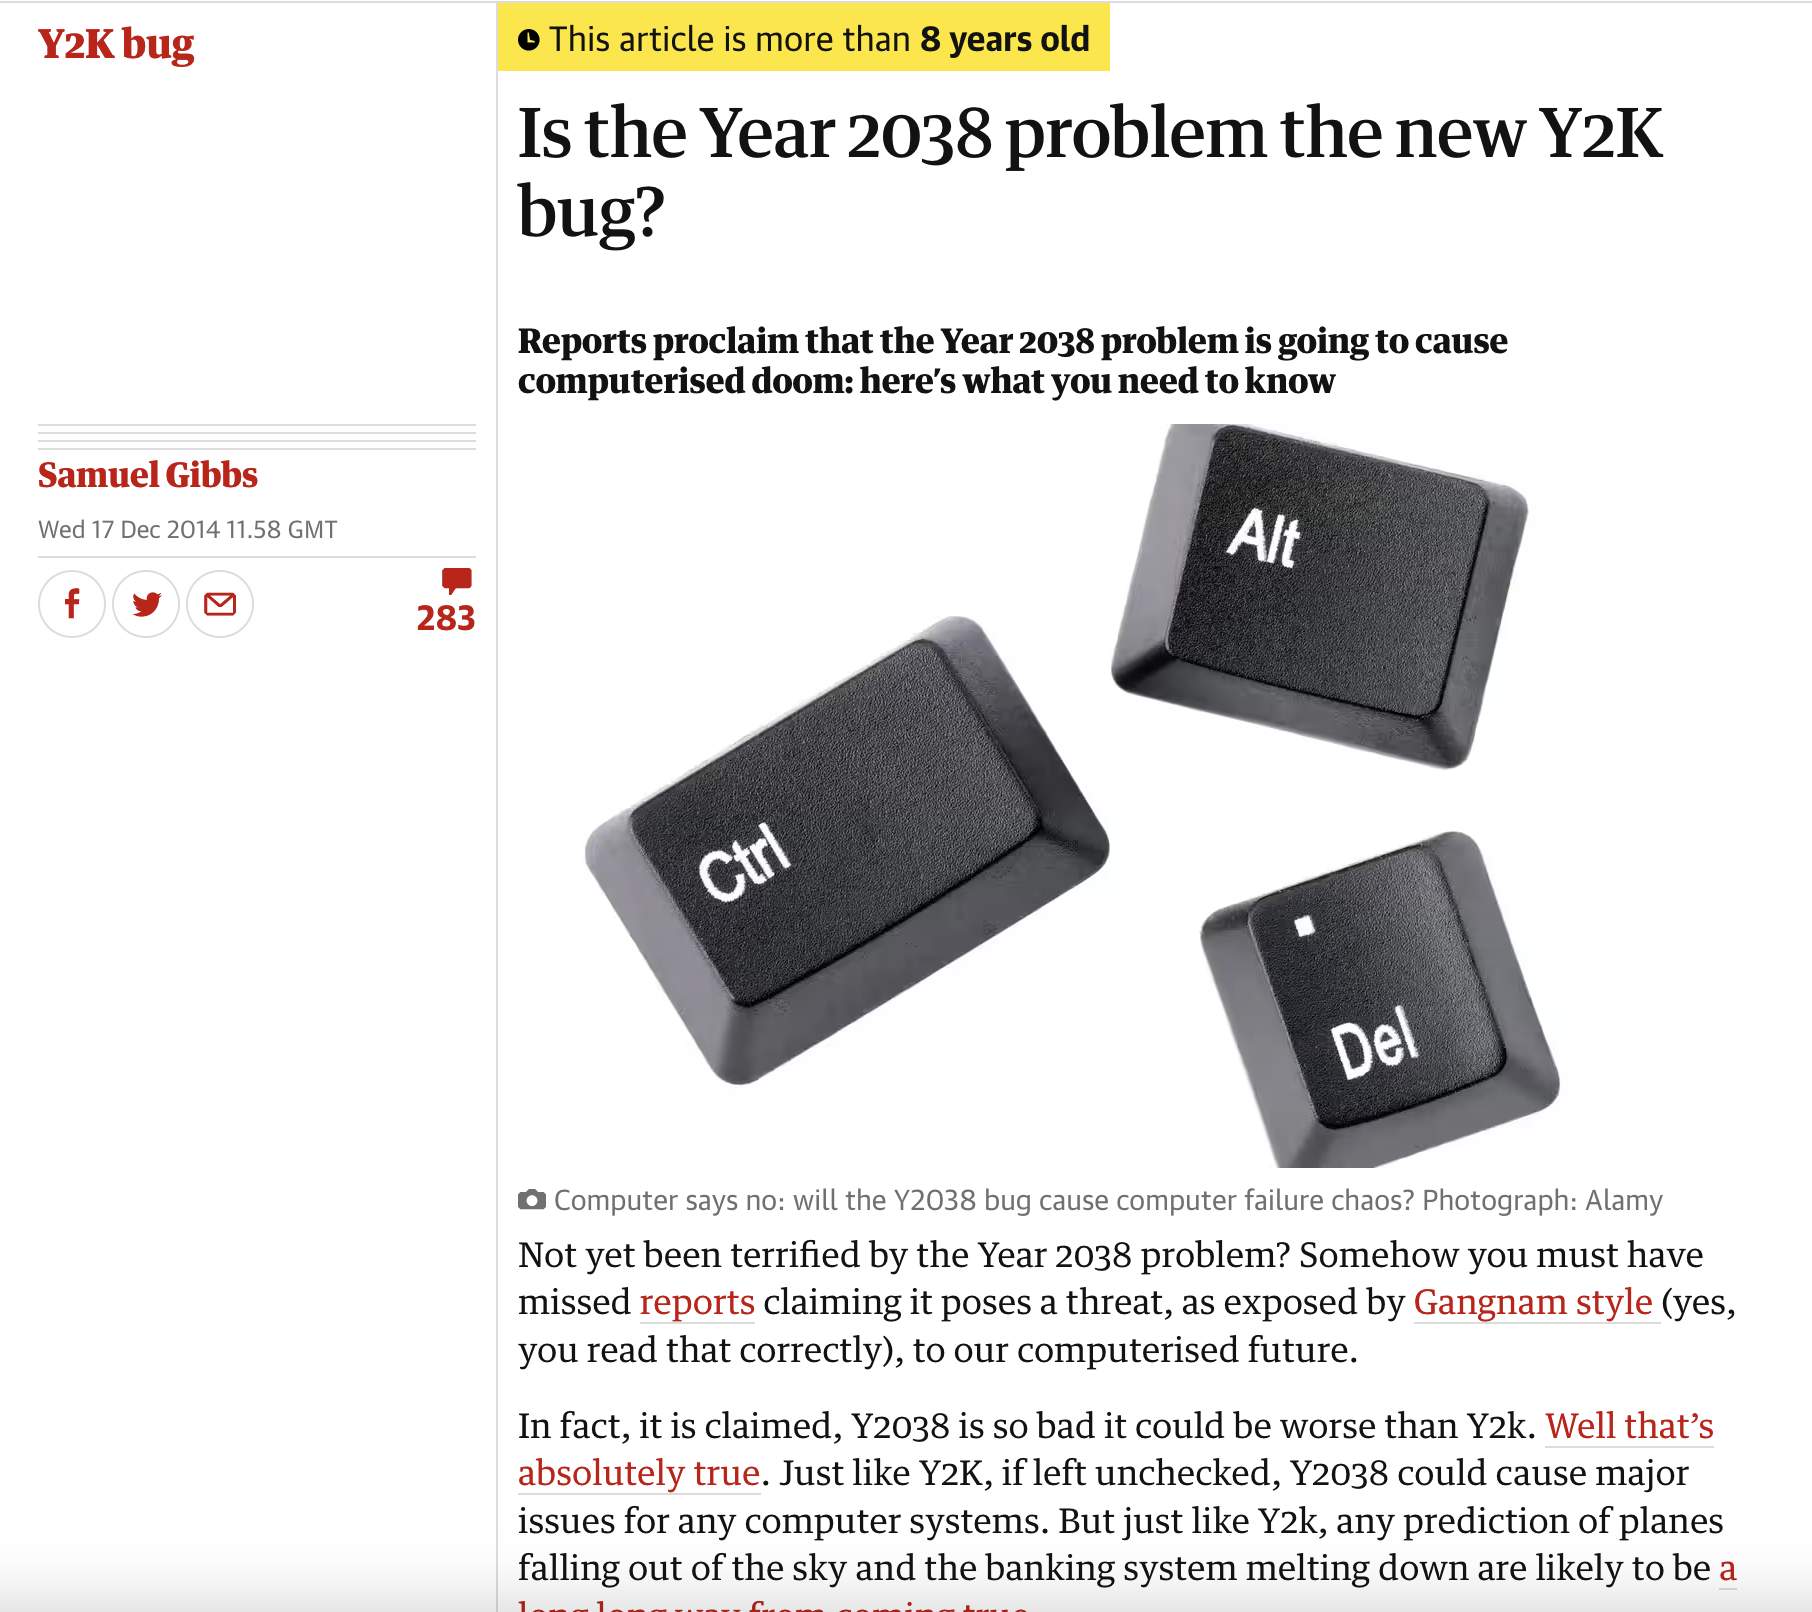
Reference: (Gibbs 2014a)
Unix timestamps count seconds since January 1, 1970
32-bit systems will overflow on: January 19, 2038 at 03:14:07 UTC
Solution: Upgrade to 64-bit systems (happening now)
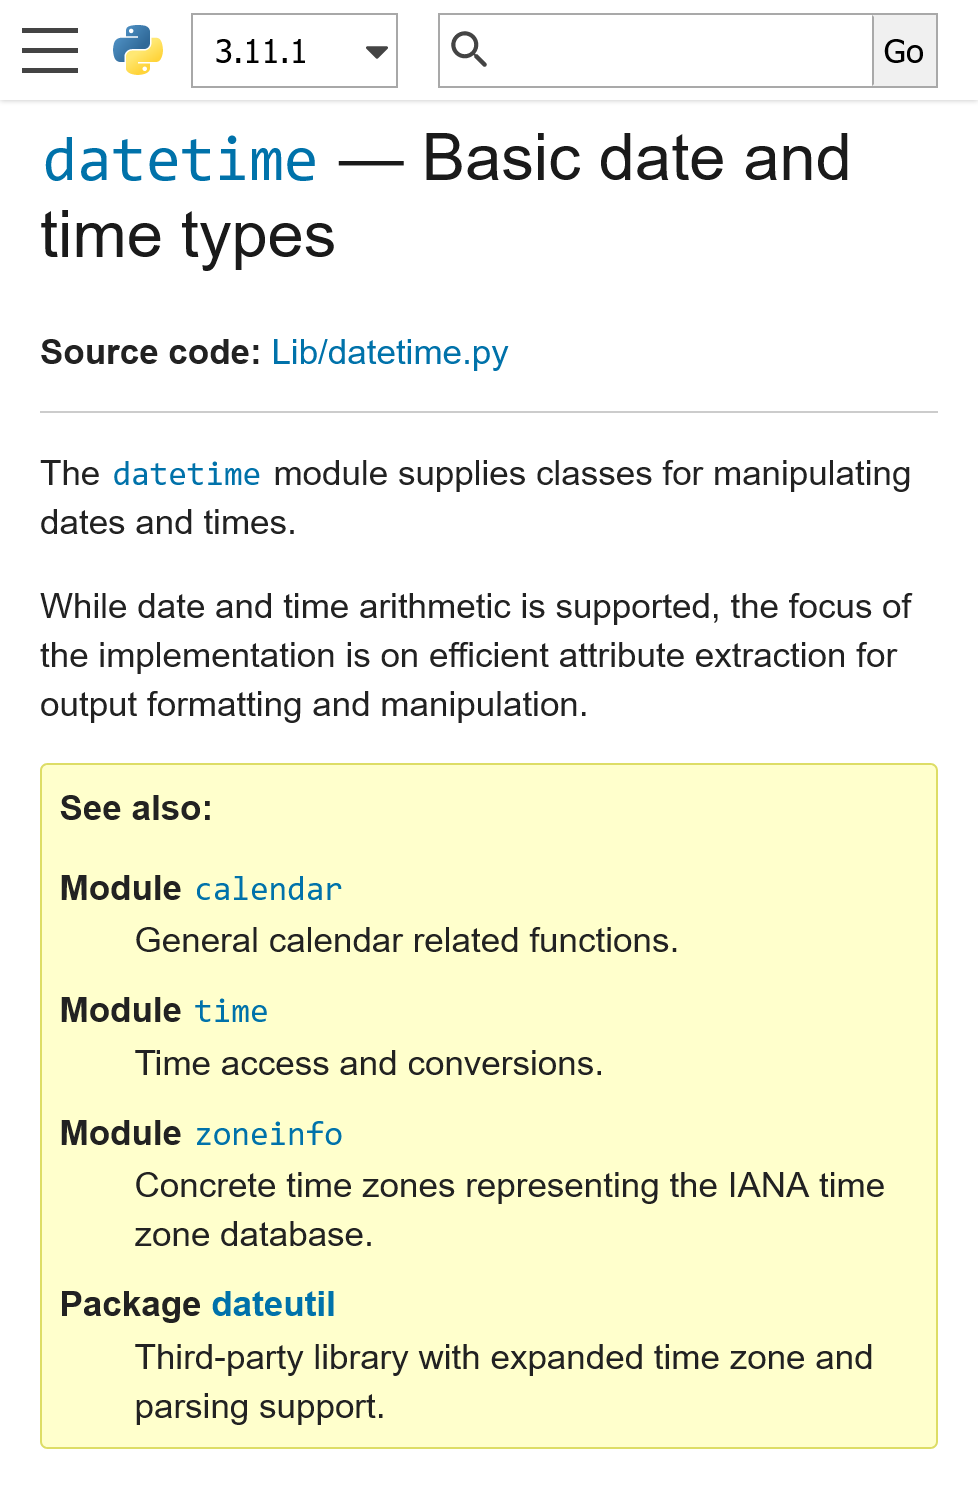
Working with Dates in Practice
The challenge:
- Global format variations
- Mixed formats in same dataset
- Time zones and daylight saving
- Leap years and calendar quirks
The solution: Use specialized libraries
- R:
lubridatepackage - Python:
datetimemodule
These handle the complexity for you!

Break Time! ☕

Coming up after the break:
- File formats demystified
- Tidy data principles
- Excel horror stories
- Hands-on examples
JSON: Visualized

Flat structure - Simple and direct
Nested JSON Visualized

Nested structure
- Grouping related data
What Makes Data Messy?
🤔 Discussion: What’s wrong with this spreadsheet for data analysis?
Take 30 seconds to think about it…
Horror Story #1: Gene Names
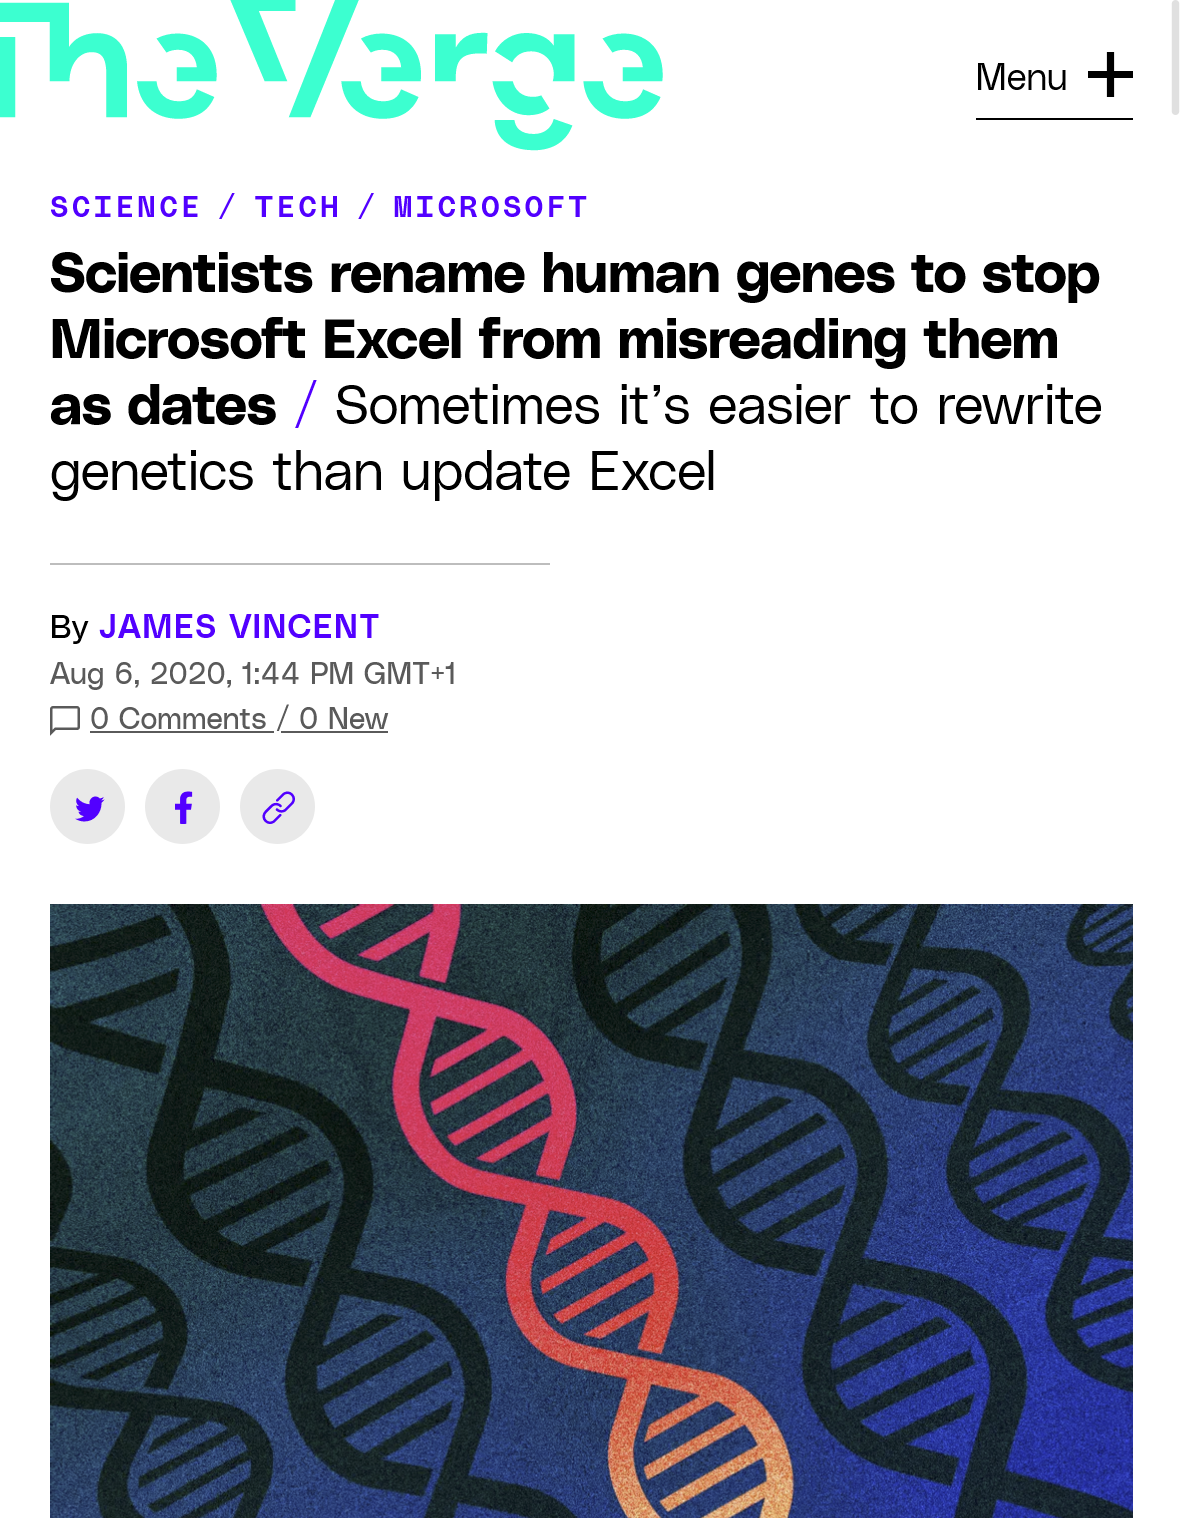
Source: (Vincent 2020)
What happened:
- Excel auto-converted gene names to dates
- MARCH1 (short for “Membrane Associated Ring-CH-Type Finger 1”) → 1-Mar
- SEPT2 (short for “Septin 2”)→ 2-Sep
The scale:
- 2016 study (Ziemann, Eren, and El-Osta 2016): ~20% of 3,597 genomics papers affected by Excel gene name conversion
- 2021 follow-up (Abeysooriya et al. 2021): Still 30.9% of 11,117 papers had errors
- Problem persisted despite awareness!
The fix: 27 genes officially renamed (MARCH1 → MARCHF1)
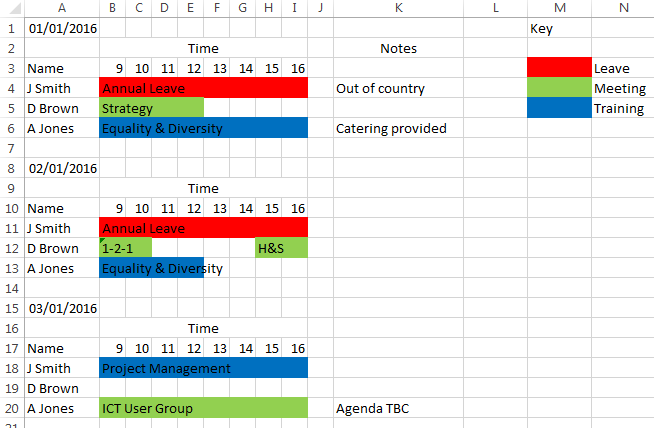
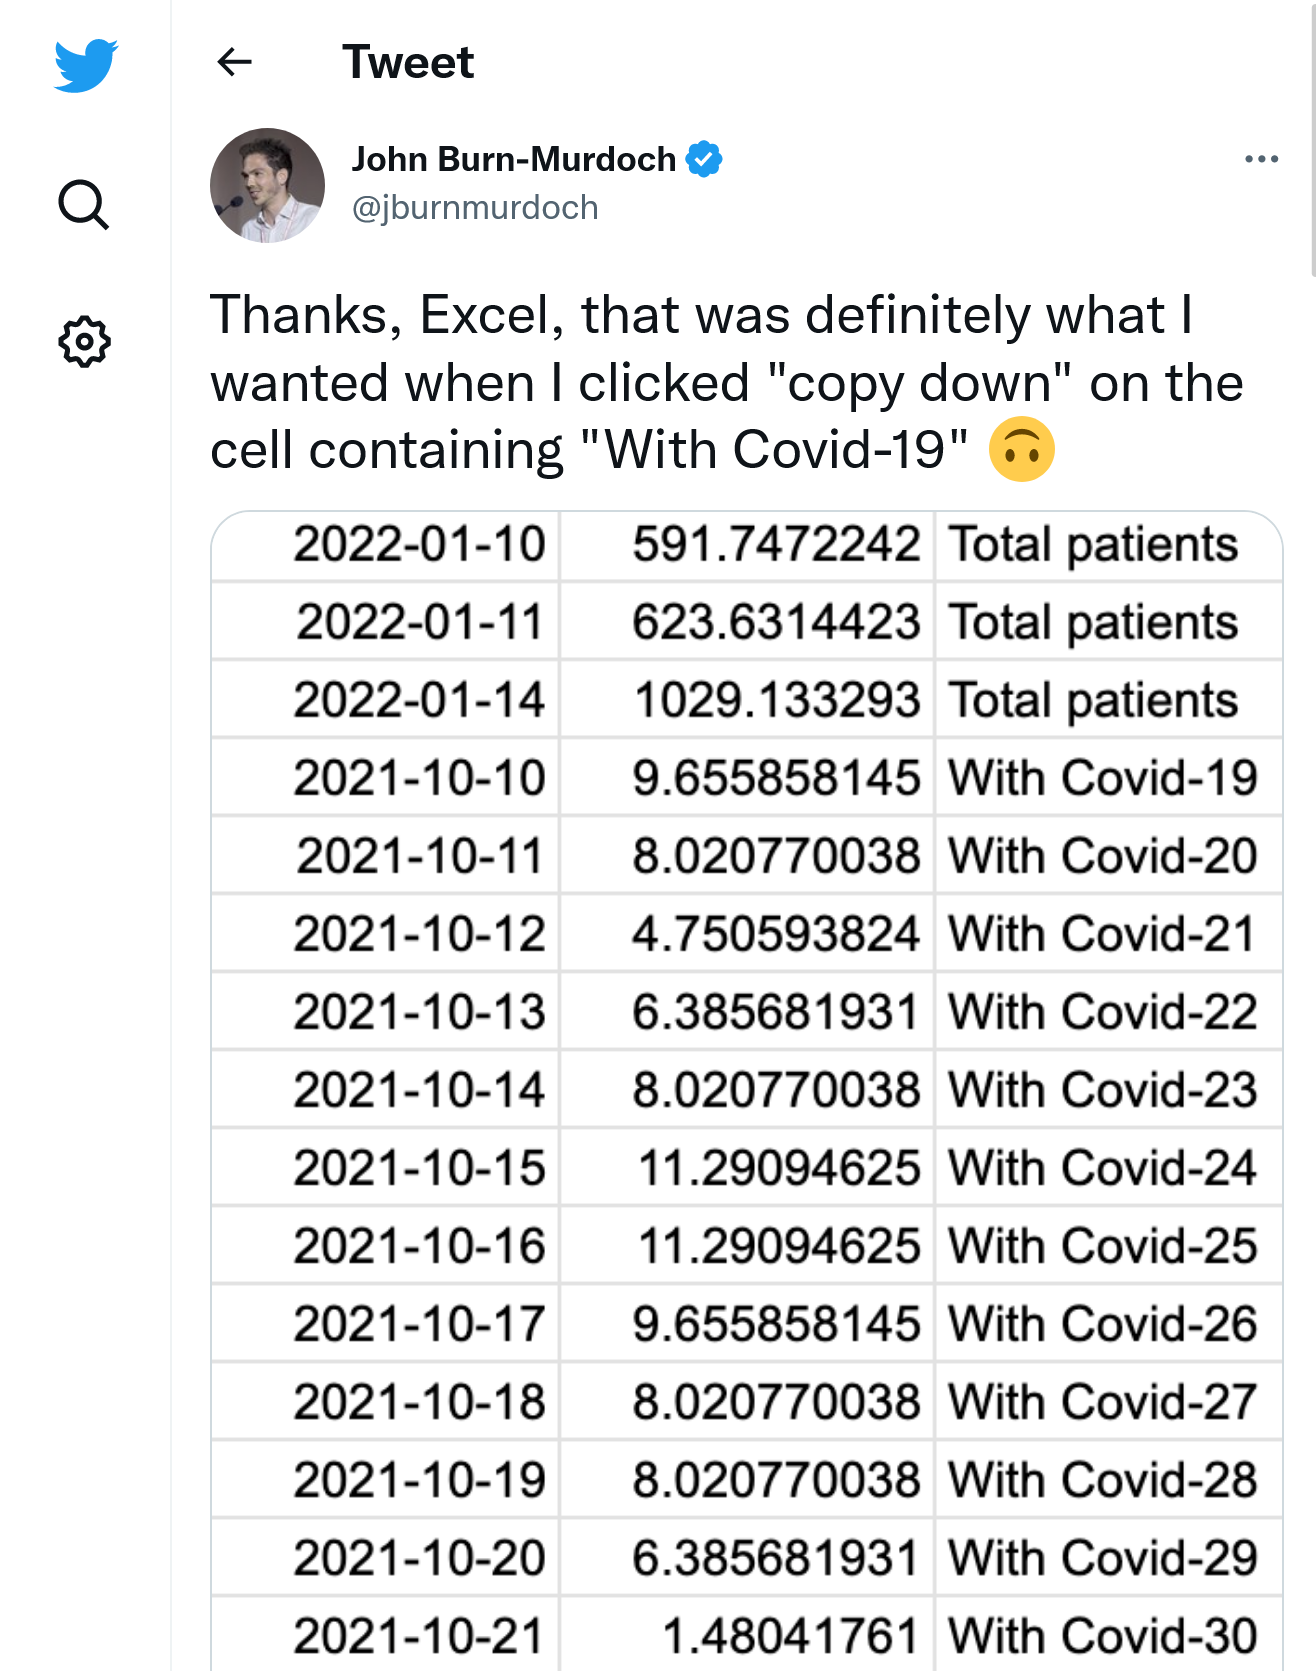
Horror Story #2: COVID-19 Data Loss
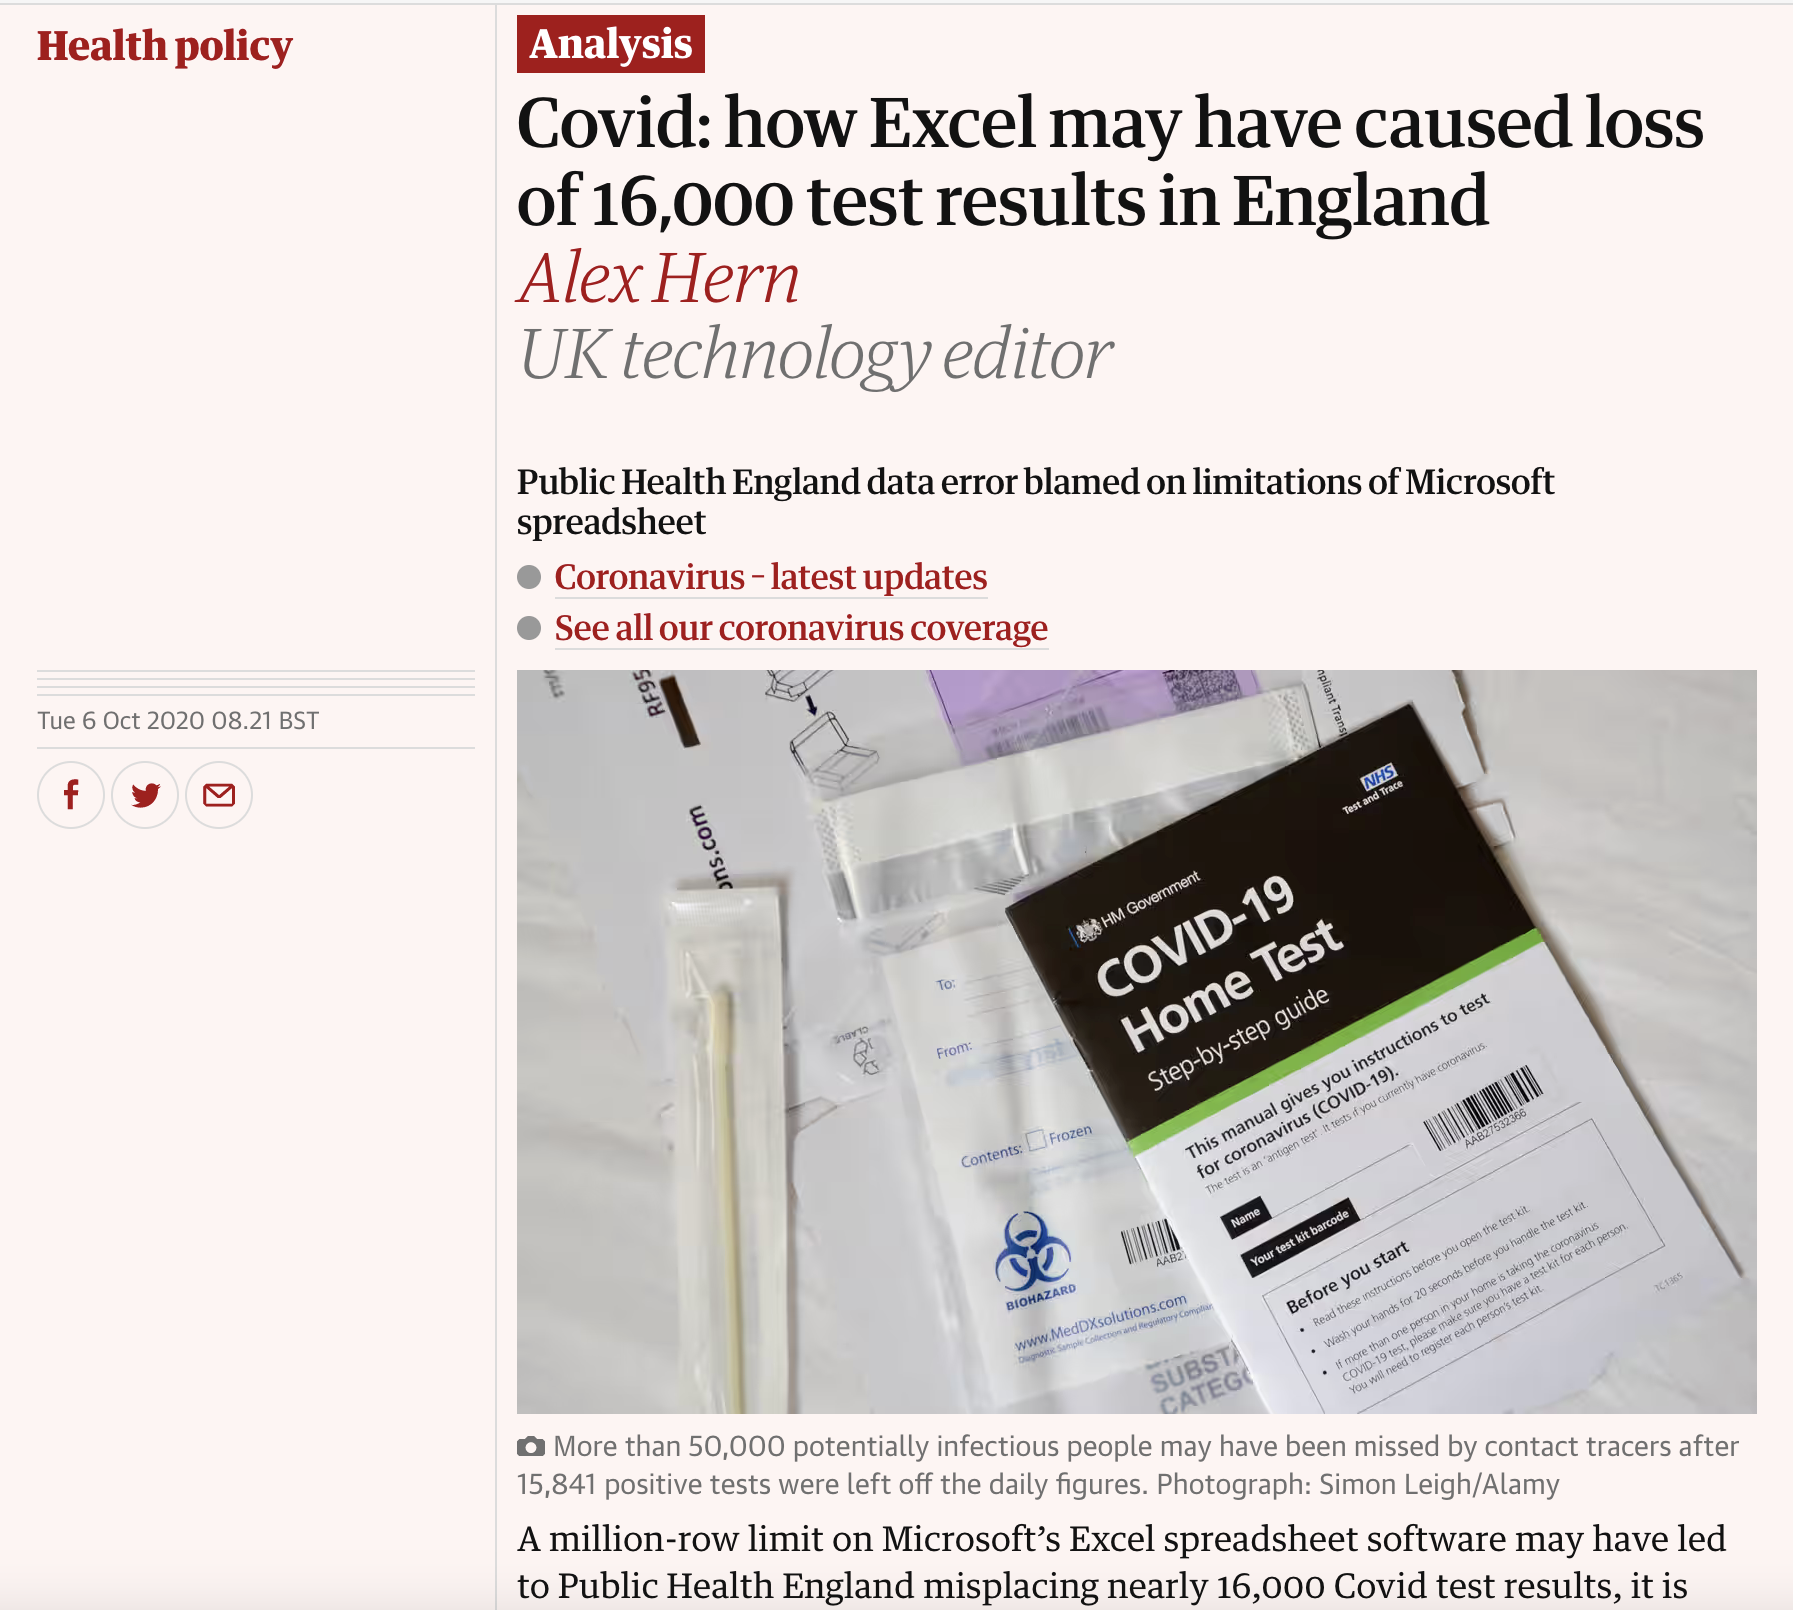
Source: (Hern 2020)
The incident:
- UK Public Health England used Excel as exchange format with local trusts
- Hit the 65,536 row limit
- Lost 16,000 COVID cases
- Delayed contact tracing
Impact: Lives at risk
Horror Story #3: Economic Policy
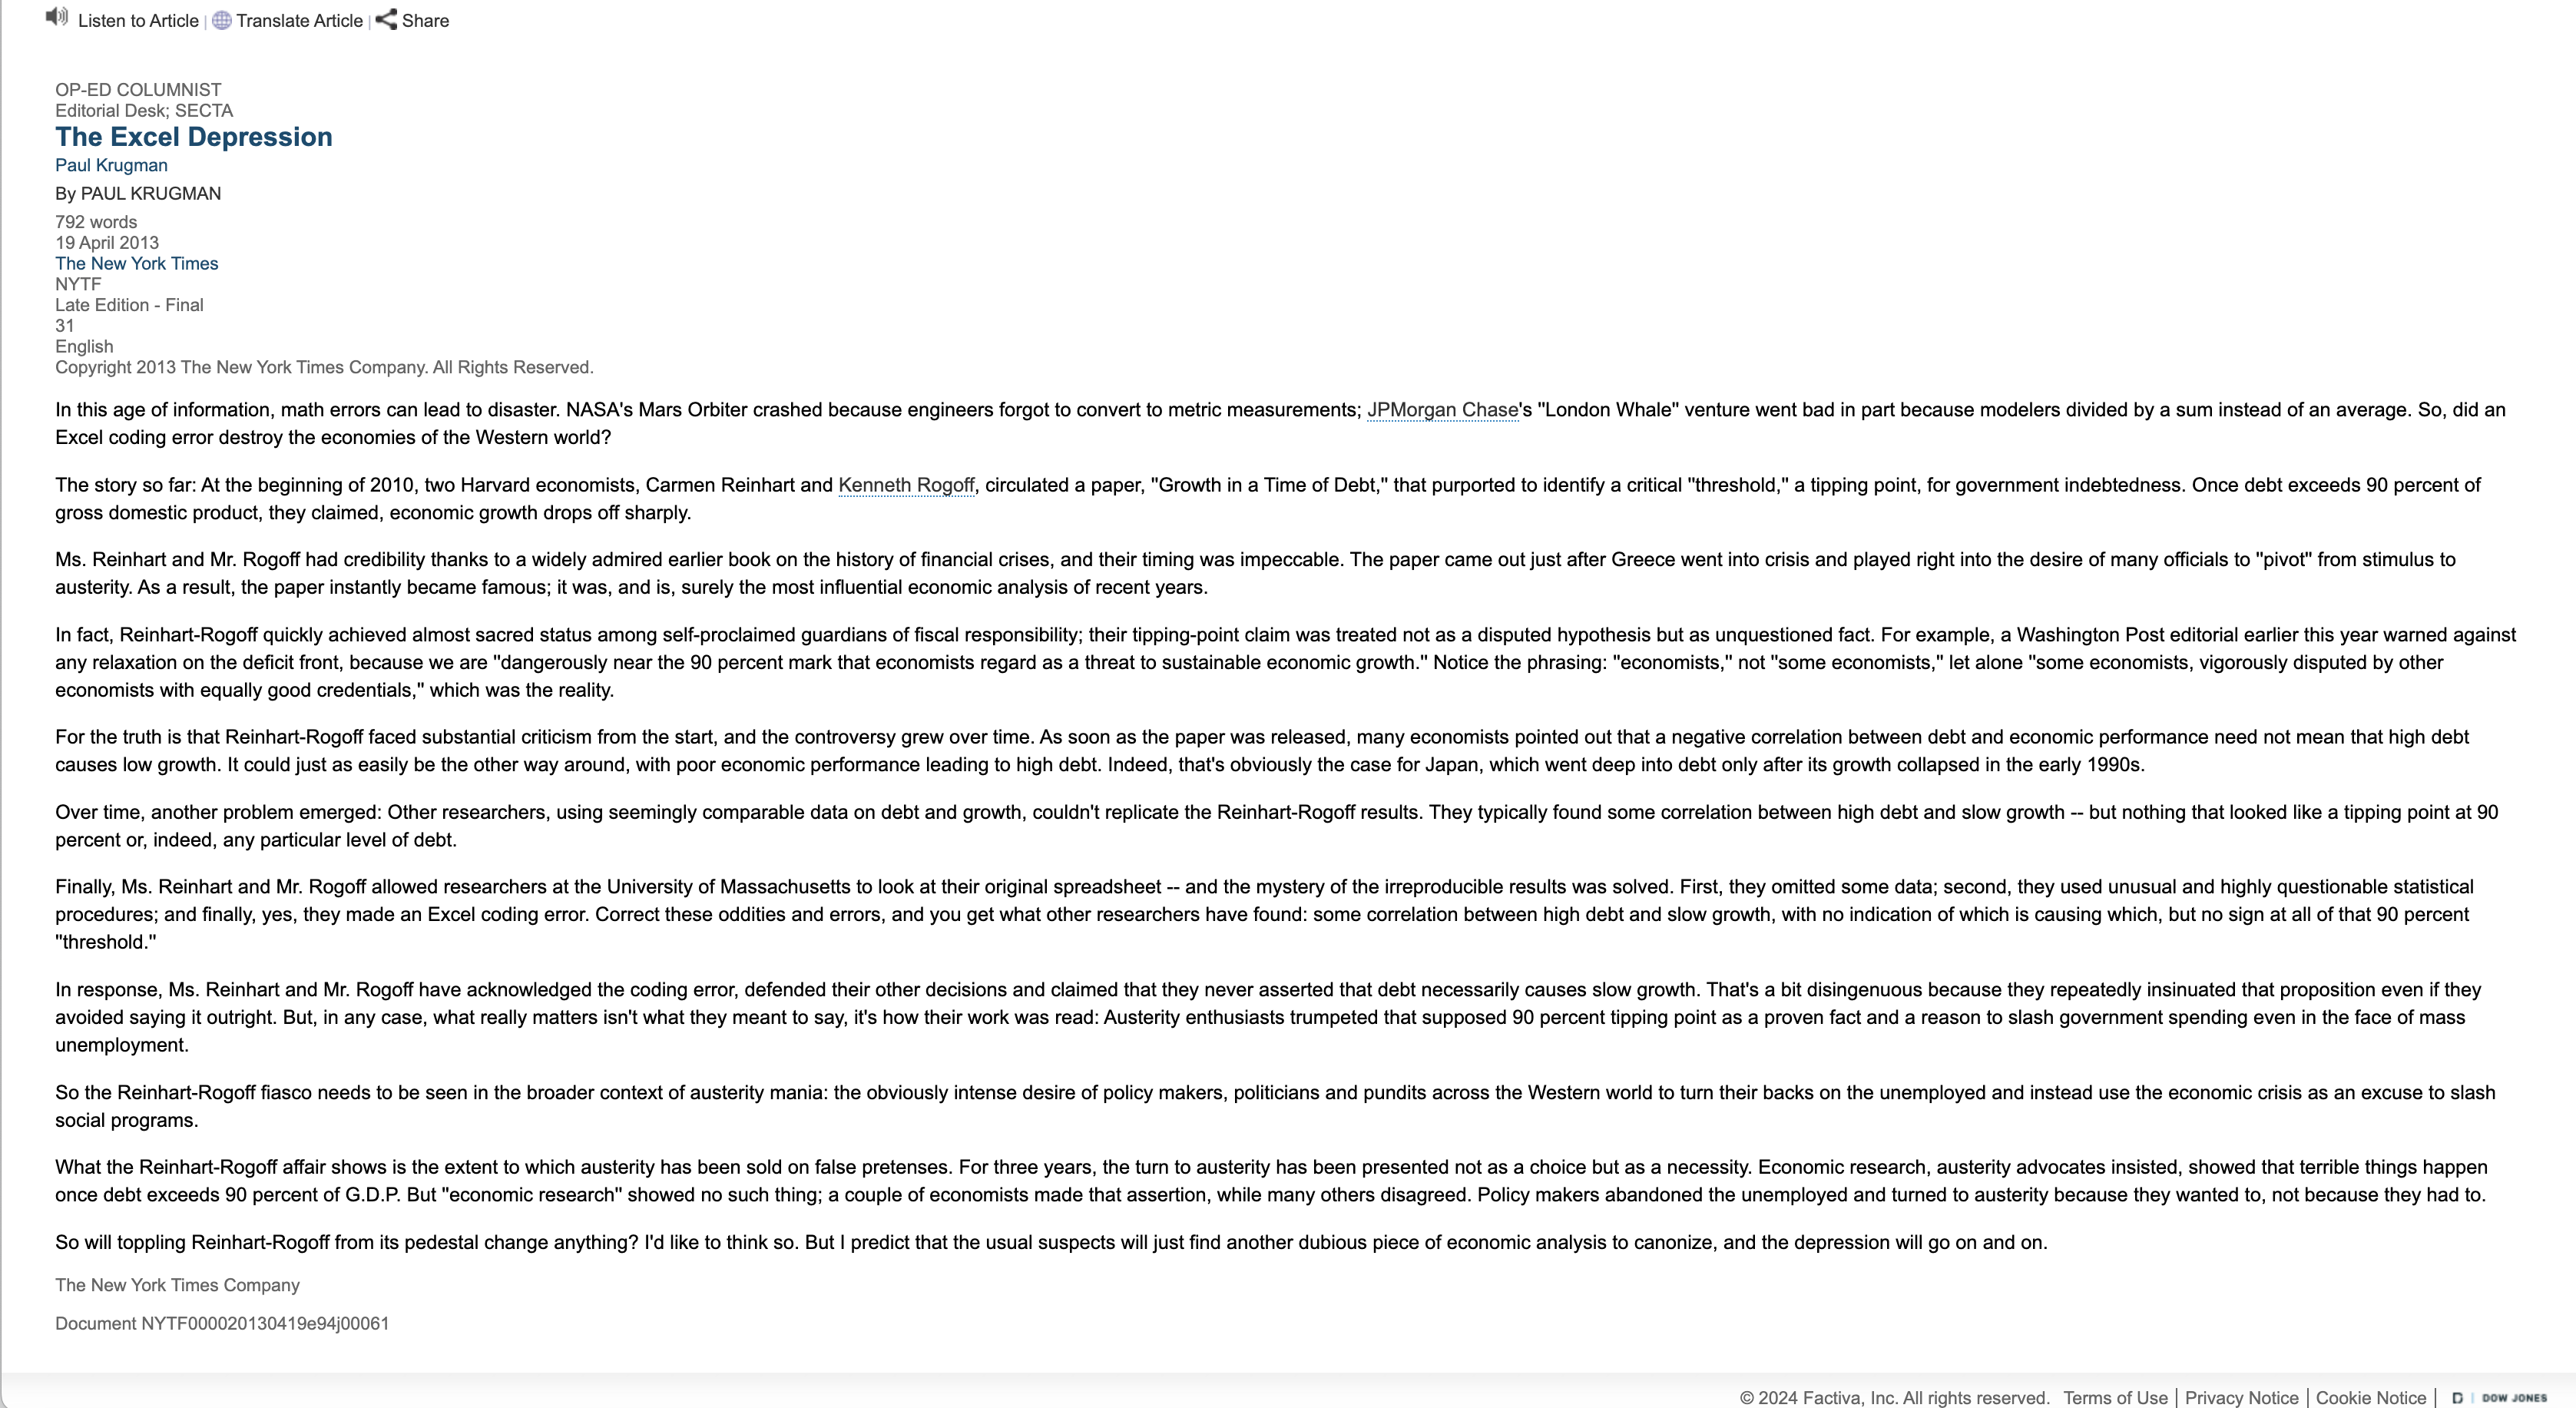
Source: (“The Excel Depression” 2013)
Reinhart-Rogoff spreadsheet error:
- Influential economics paper
- Original results showed average real economic growth slows (a 0.1% decline) when a country’s debt rises to more than 90% of gross domestic product
- Influenced austerity policies globally
- But, Excel formula excluded 5 rows (i.e 5 countries: Australia, Austria, Belgium, Canada and Denmark)
- Wrong conclusions about debt/GDP (when that error was corrected, the “0.1% decline” data became a 2.2% average increase in economic growth)
Lesson: Always check your formulas!
Horror Story #4: The London Whale
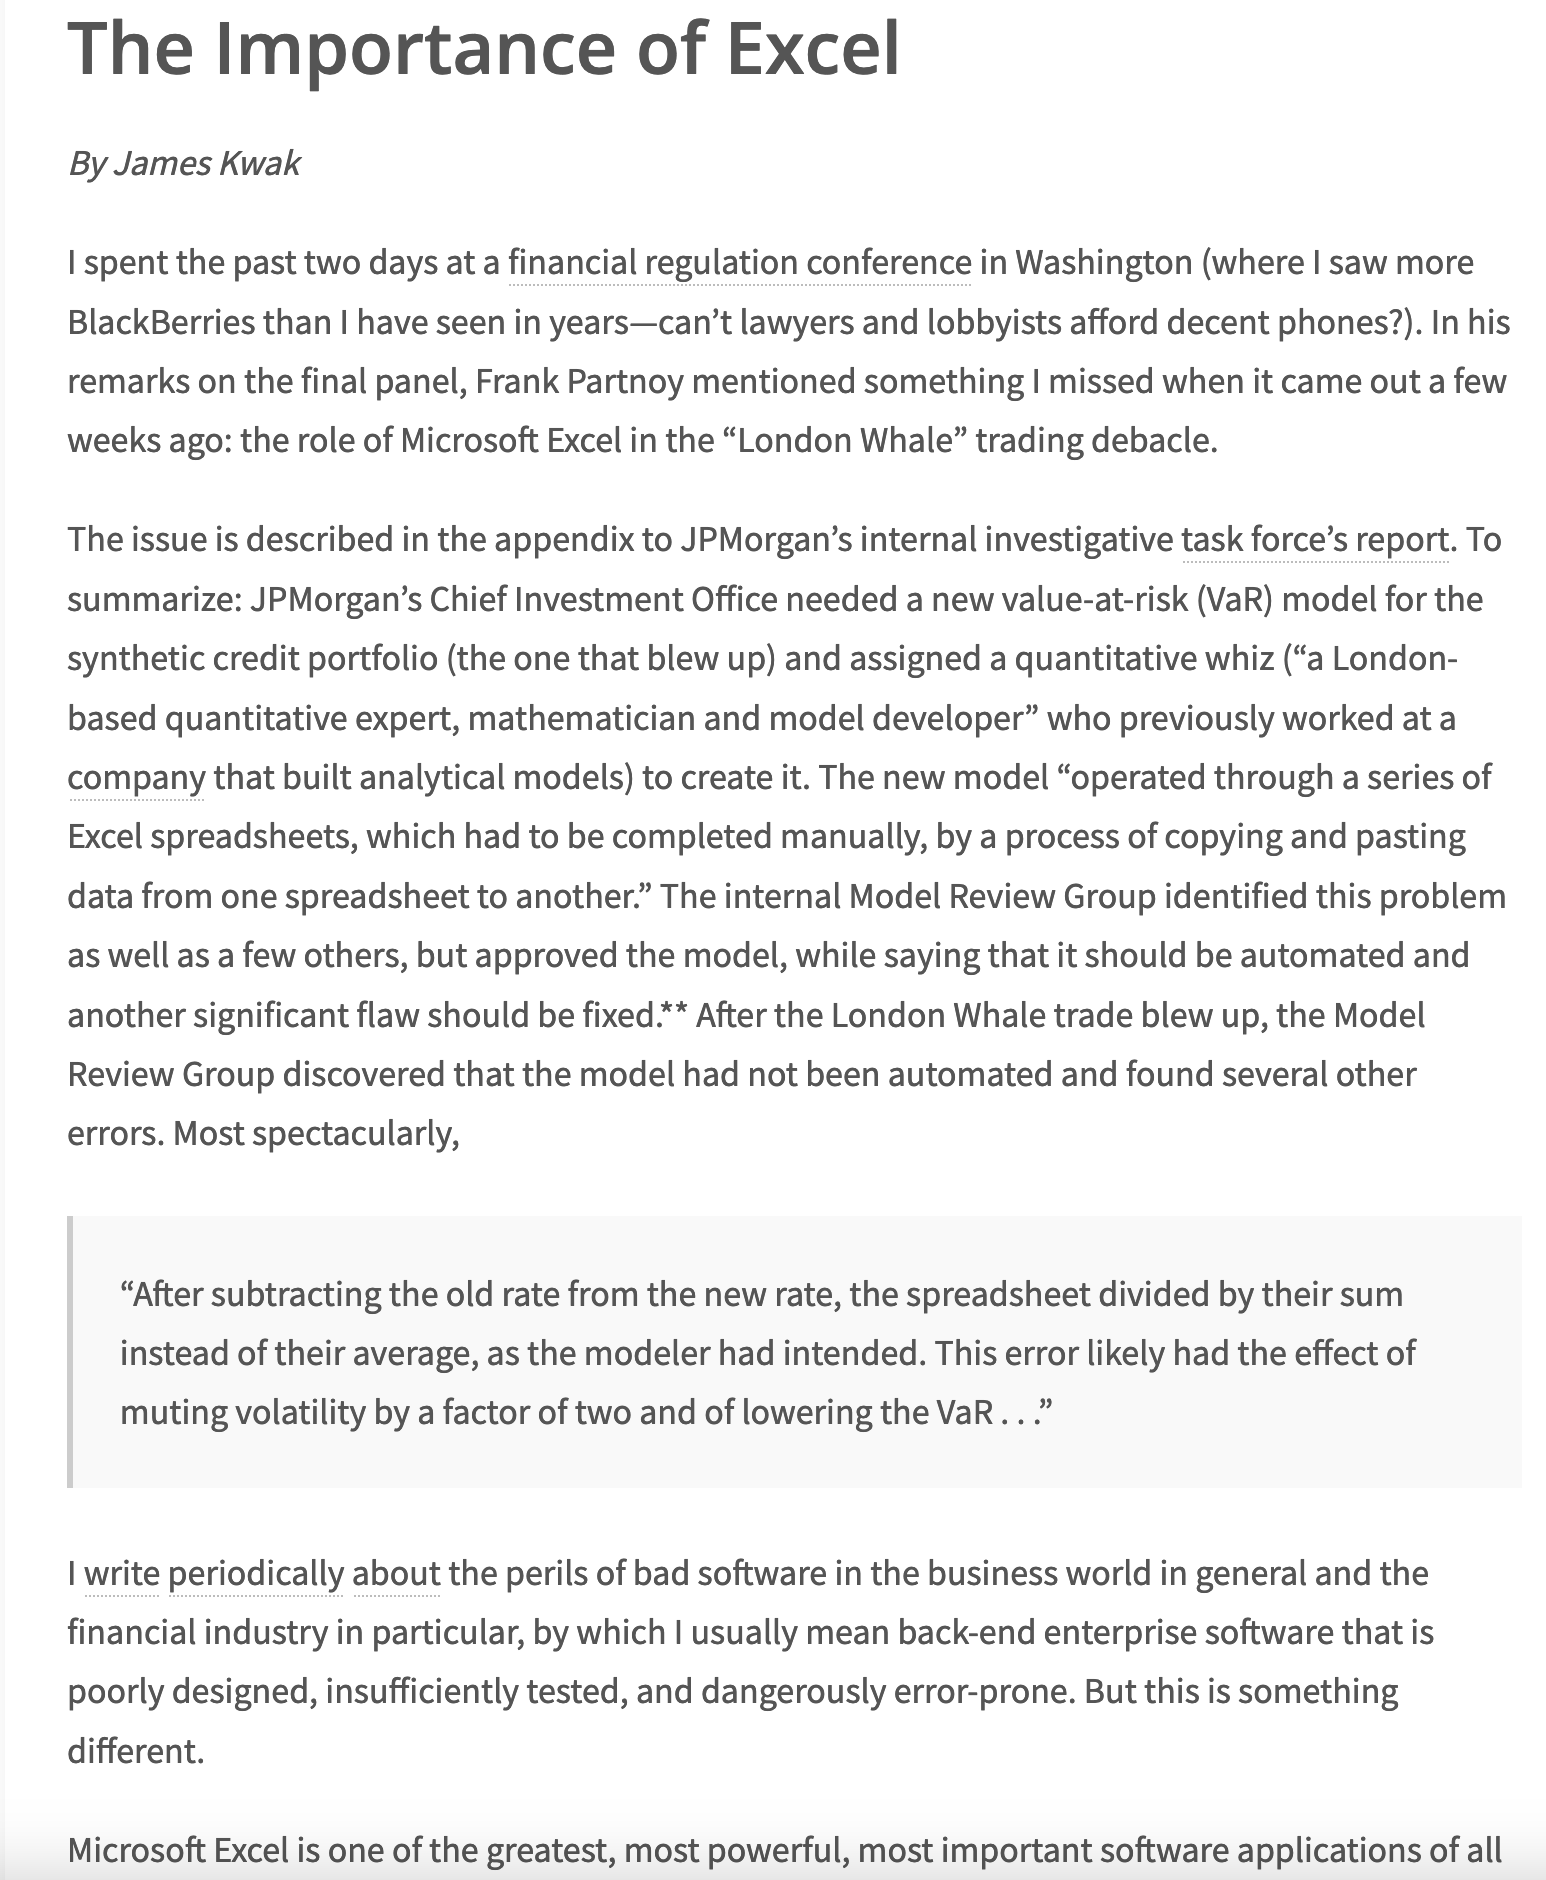
Source: (Kwak 2013)
Horror Story #4: The London Whale
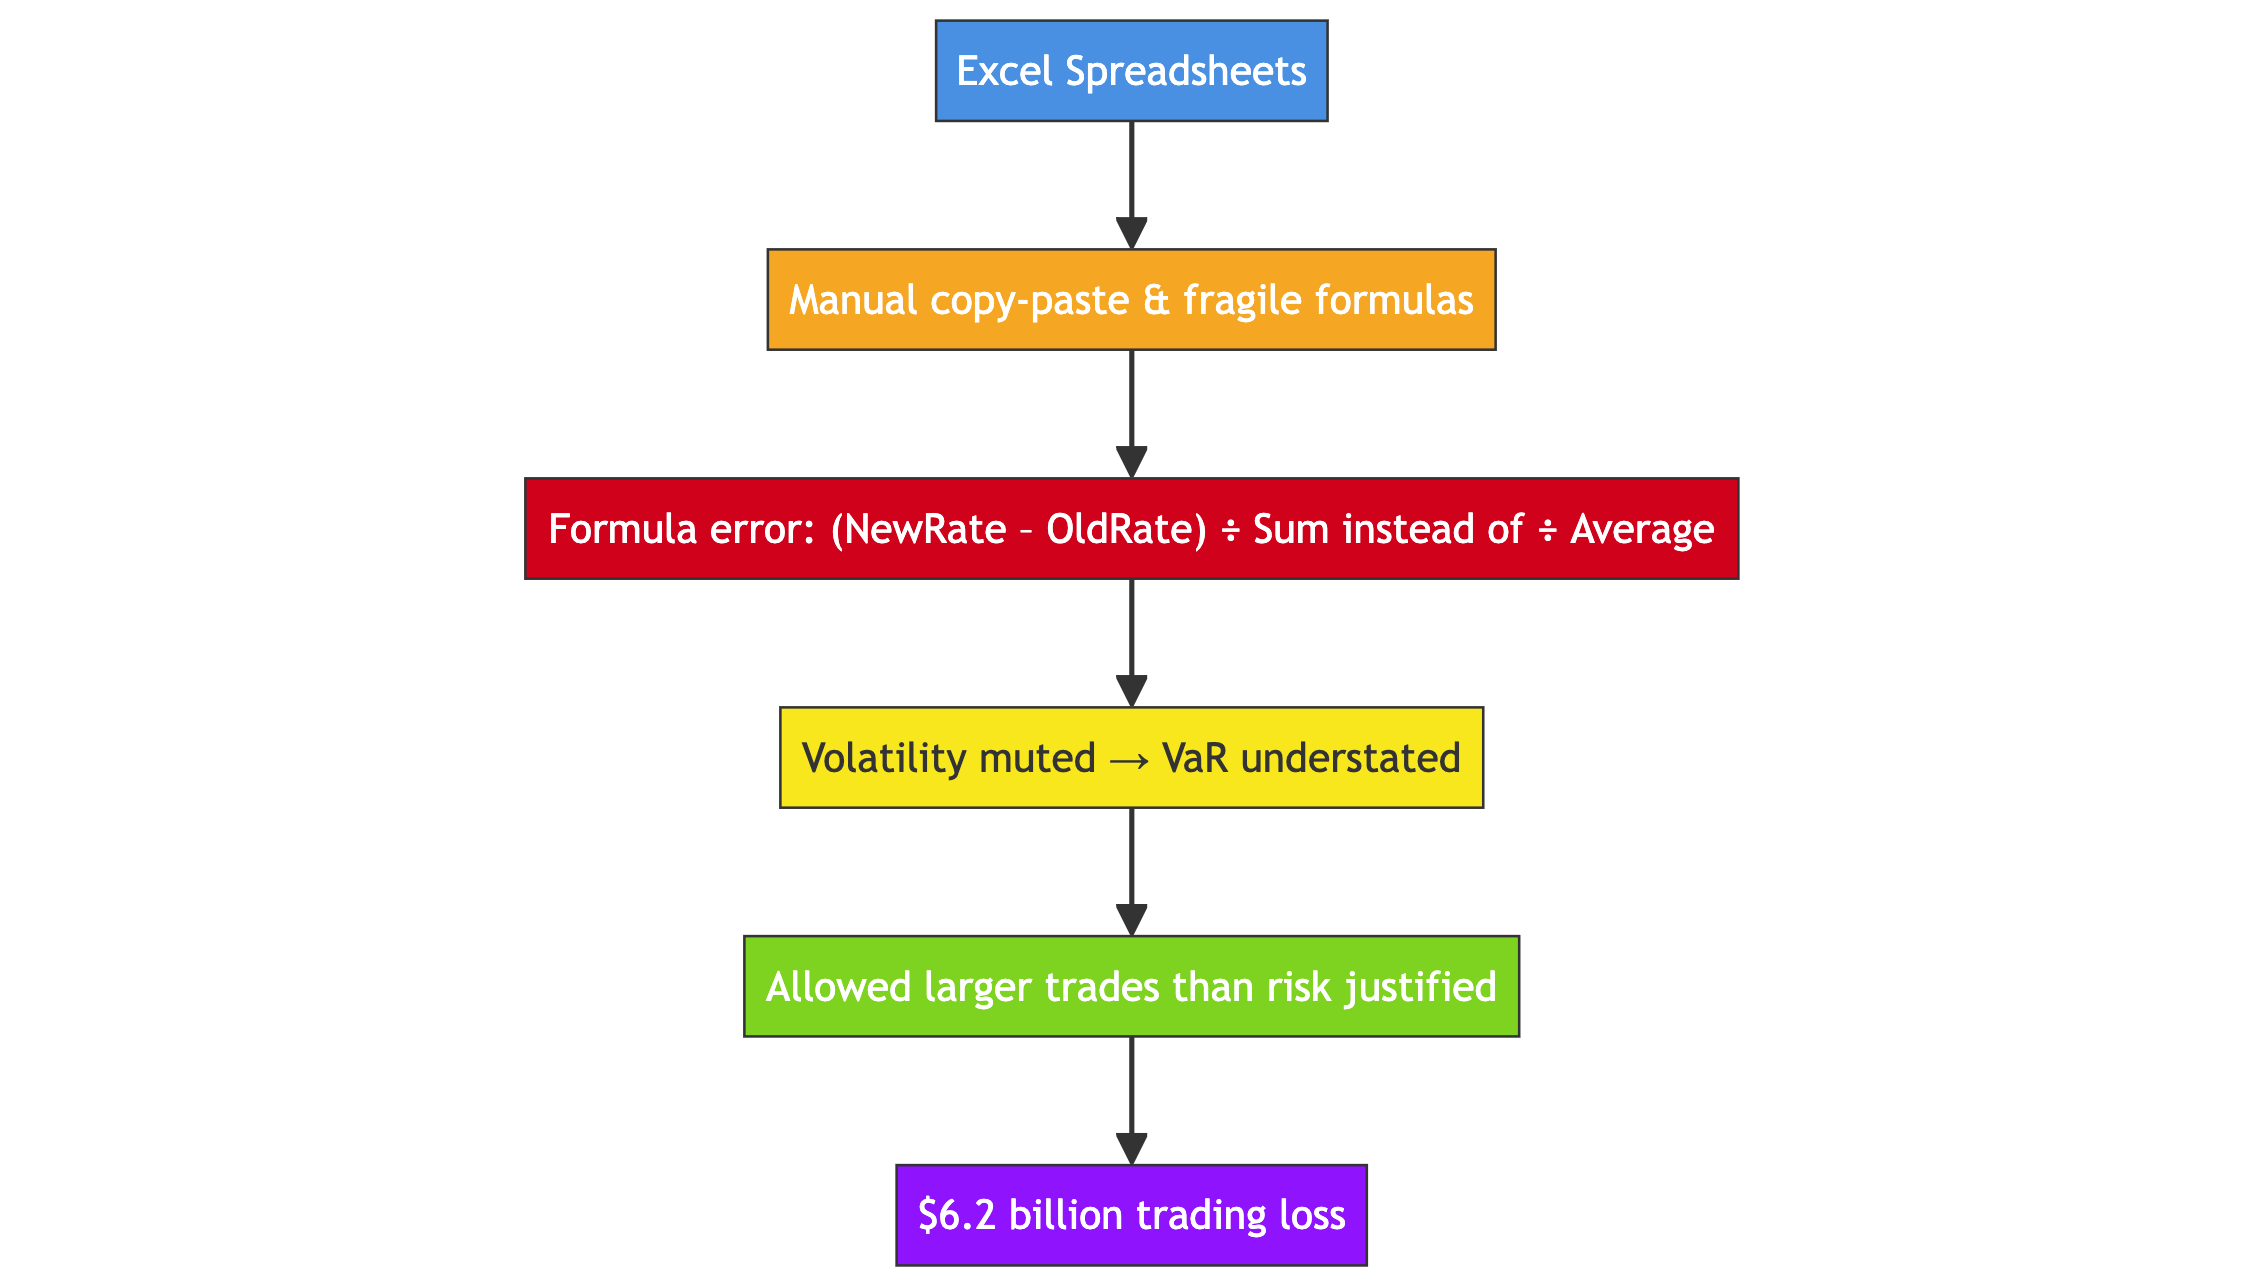
JP Morgan VaR Model (2012)
- Built entirely in Excel
- Manual copy-paste & fragile formulas
- Formula error: divided by sum instead of average → VaR understated
- Model review flagged issues but flaws never fixed
- Resulted in $6.2 billion trading loss
Lesson:
Even sophisticated financial models fail on fragile, manually managed software. Critical calculations need robust, auditable systems.
Horror Story #5: Microsoft and Finance

Source: (Beales 2013)
A pattern of Excel-related failures:
2007 CPDOs (i.e Constant proportion debt obligations): Moody’s coding error inflated structured finance ratings (pre-crisis)
2012 London Whale: JPMorgan’s Excel-based risk model failures ($6.2B loss)
2013 Reinhart-Rogoff: Spreadsheet error undermined influential austerity research
The pattern: Office tools used as substitutes for proper systems and critical thinking
The Excel Takeaway
Excel is NOT for:
- Serious data science
- Reproducible analysis
- Large-scale data processing
- Production systems
Excel IS fine for:
- Quick data exploration
- Small personal datasets
- Initial data entry
- Simple calculations
Just know its limitations!
What Is Tidy Data?
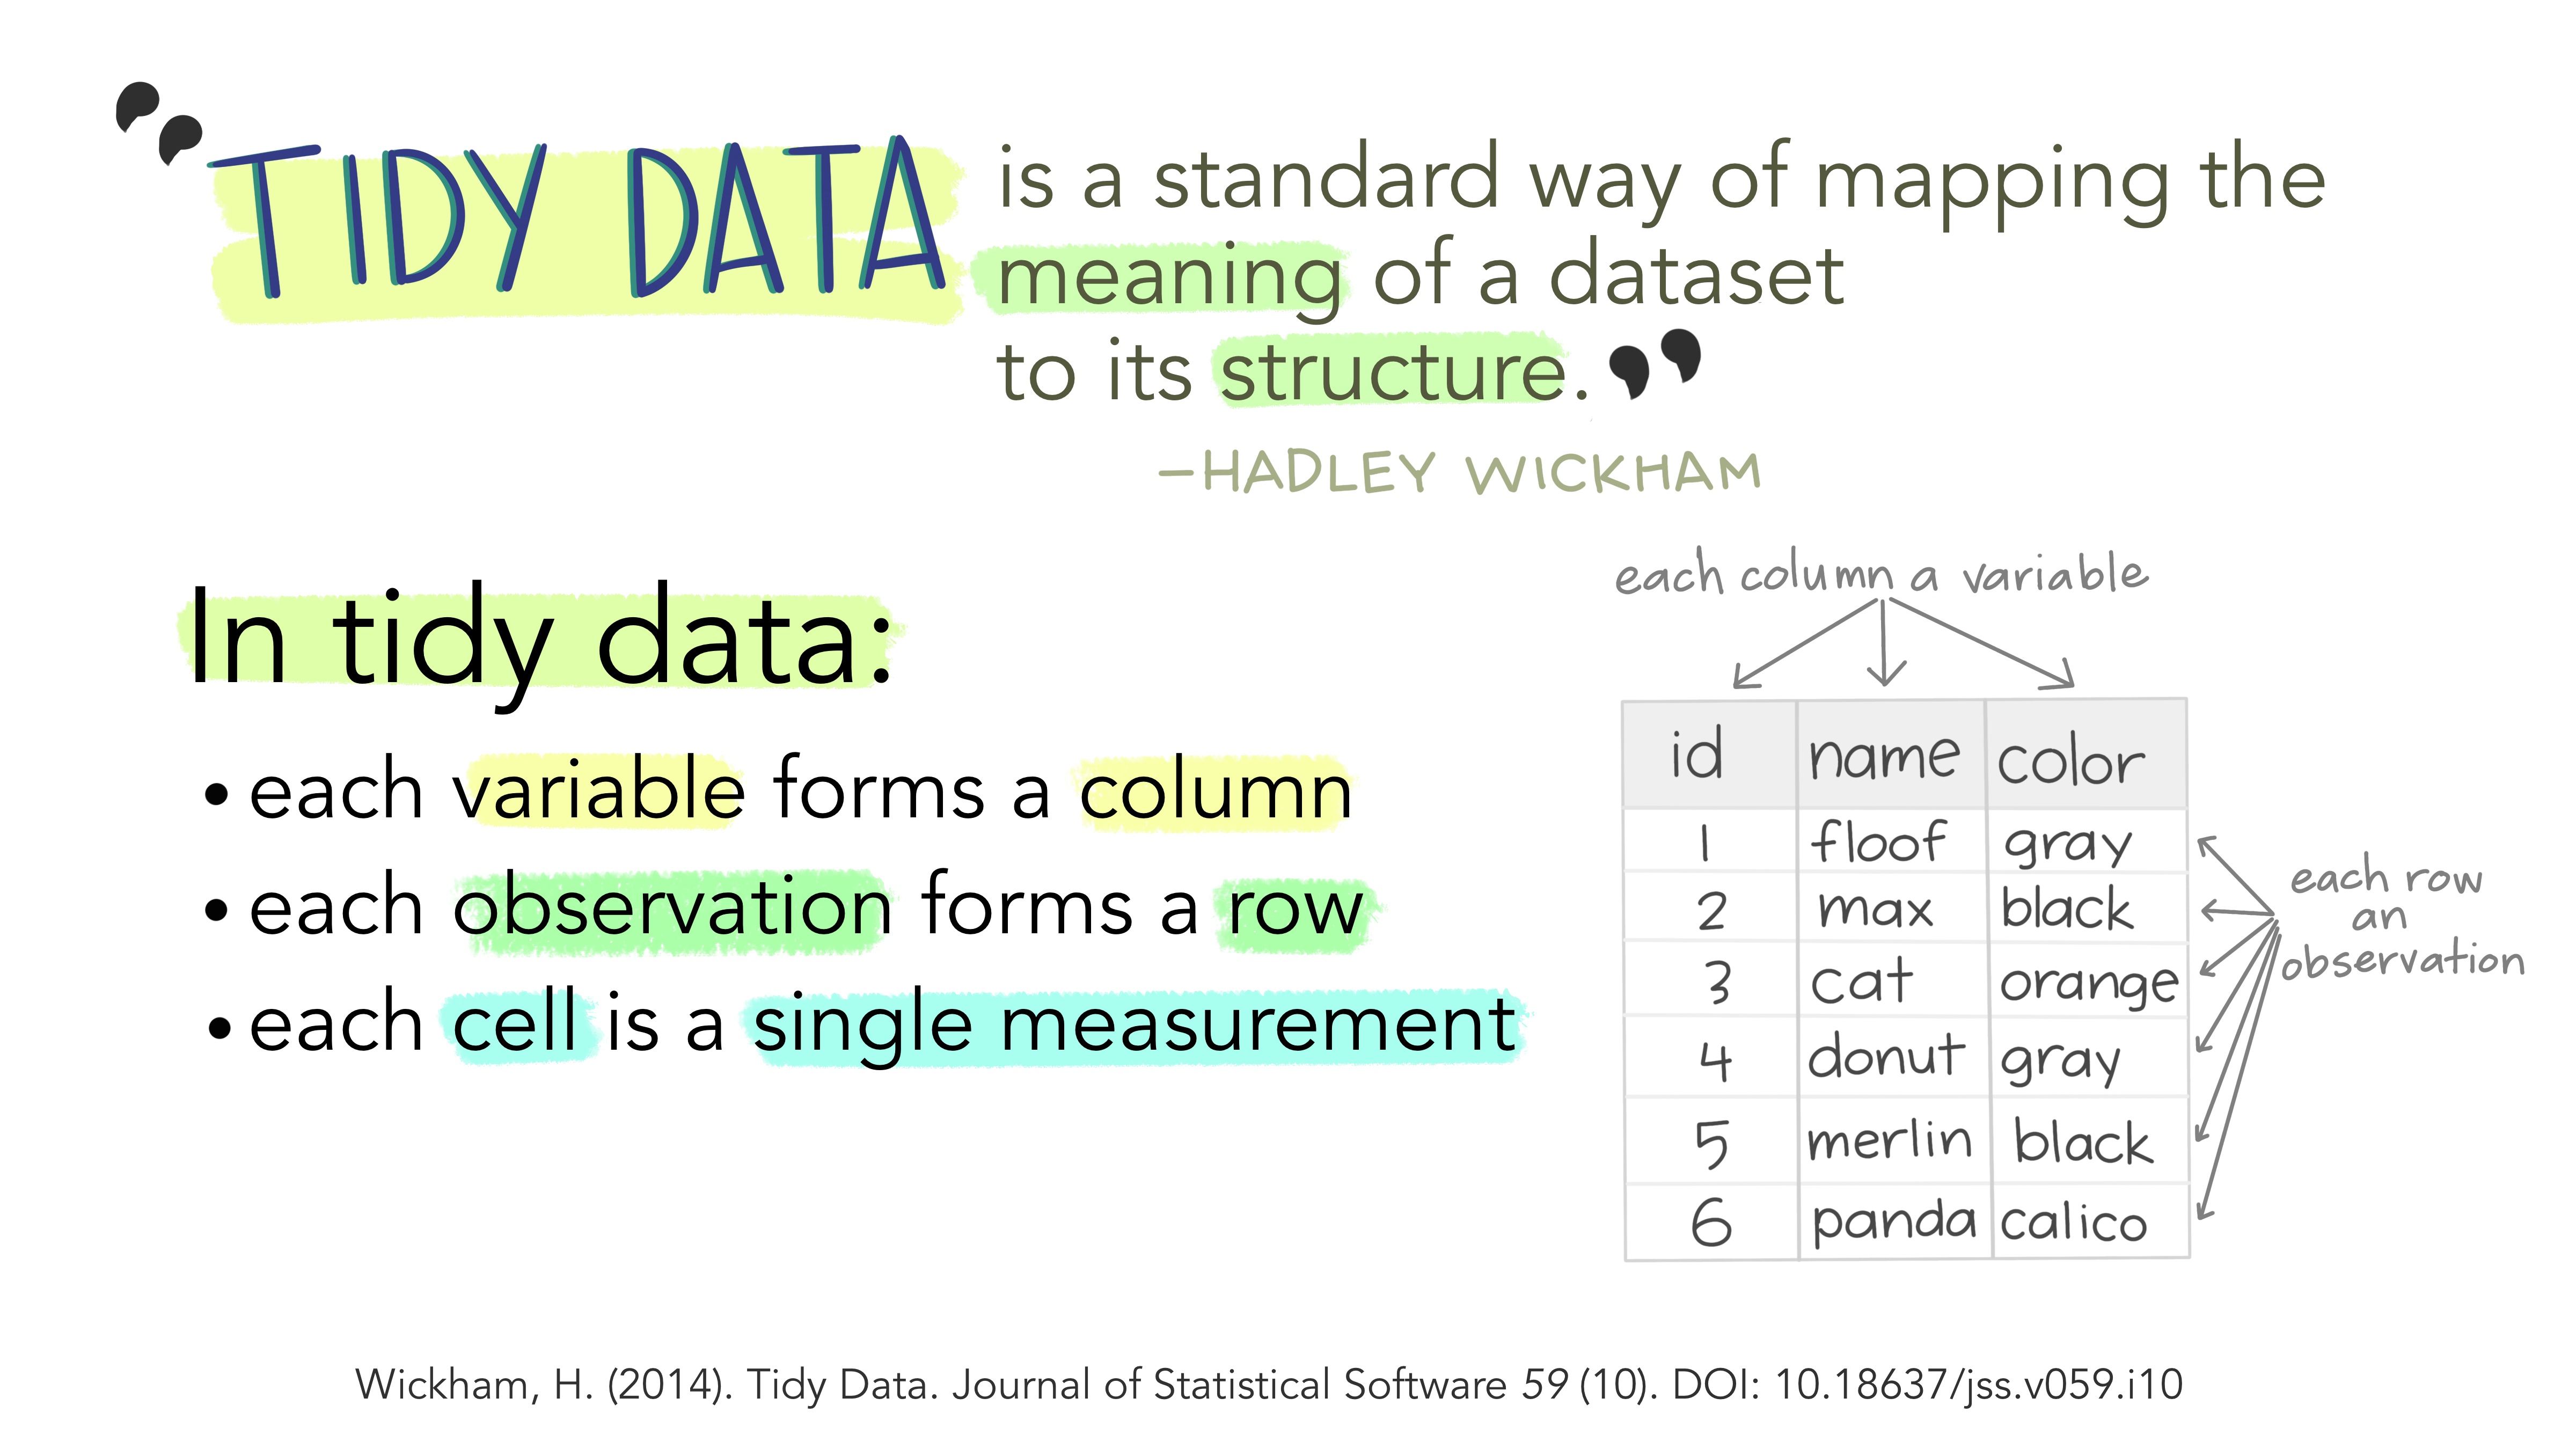
A specific structure that makes analysis easier
Questions?
Office hours: Check StudentHub/course website for times
Discussion forum: Post questions on Slack for peer support or for support from teachers
Email or Slack private messages: For personal queries (prefer Slack as there is some latency in responding to emails)
Remember: Your first summative is due Week 04 (October 21st)